Probabilistic Trend Family (PTF)

The Probabilistic Trend Family (PTF) modeling framework is described in the paper "Best Estimates for Reserves", published in the Proceedings of the CAS, Volume LXXXVII, 2000. The paper is also included in the 2005 Casualty Actuarial Society Syllabus of Examinations.
In the PTF modeling framework an optimal model is identified, equivalently, built or designed that captures the variability (volatility) in the incremental loss development array. The variability is described using four components of interest. Namely, trends in the three directions: development period, accident period and calendar period, and the variability of the data about the trend structure. The (process) variability is an integral part of the model.
It is axiomatic that calendar year trends project in the other two directions. This concept is described briefly below. Further details are discussed in the paper "Best Estimates for Reserves".
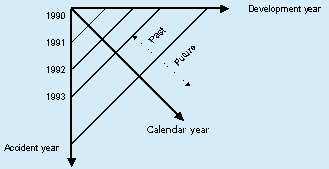
The above illustrates the geometry of the trend structure. It is clear from this illustration that the development year and accident year periods are orthogonal - that is, trends in either direction do not project onto the other. The calendar year, however, is clearly not orthogonal to either the development or accident years. A change in trend in the calendar year direction will project onto both the development and accident periods. Similarly, changes in development and accident year periods project onto the calendar year periods.
The actual (real) development array is regarded as a sample path from the identified probabilistic model. If other loss development arrays are simulated from the identified model then one cannot distinguish in terms of features (trend structure + variability) between the real development array and the simulated development arrays.
The identified optimal model fits (lognormal) distributions to each cell in the development array and also projects lognormal distributions for each cell in the future, conditional on certain explicit assumptions. These assumptions are related to the historical experience and can be amended by the user.
A PTF based model (equivalently a stochastic method) is identified (built) either manually (in minutes) using diagnostics, discriminatory statistics and optimization algorithms. Alternatively, there is a warp speed modeling Wizard.
Here is an example of a model discussed in the paper "Best Estimates for Reserves". Each model in the PTF modeling framework is described by four graphs (pictures).
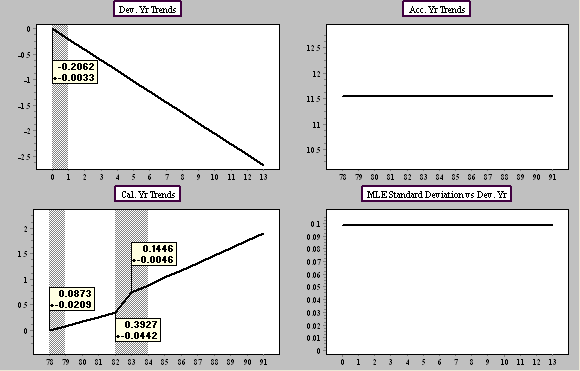
The standard deviation (graph bottom right) of the normal distributions (about the trend structure) is an integral part of the model.
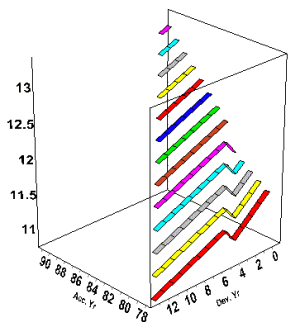
A 3D version of the model display can also be viewed as in the display below.
Since a PTF identified model forecast lognormal distributions for every cell and their correlations, prediction intervals and V@R are easily computed by accident year totals, calendar year totals and the aggregate using the PALD module. There are also applications to pricing and designing optimal outgoing and inward reinsurance.
To view the numerous significant benefits afforded by the paradigm shift, please read the brochures and view the online demonstration videos.
For more information on the distribution of aggregate reserves and on optimal reinsurance calculations see the PALD (Predictive Aggregate Loss Distribution) module.