By Ben Zehnwirth
The root cause of the HIH collapse is chronic massive under-reserving and under-pricing, and “unsustainable” growth. This was a “known known” to every “astute industry observer” before the commission convened. In fact chronic under-reserving and underpricing was acknowledged and well established in the HIH Wintherthur Memorandum (1998) offering shares to the public. Moreover, to a number of “astute industry” observers massive under-reserving was even a “known known” as far back as 10 years ago.
A special report in Best Week (“P/C Insolvency Trends Continued in 2001”, June 24, 2002) published by A.M.Best Company Inc., the eminent US insurance rating agency, asserts: “Inadequate reserves, improper pricing and unsustainable growth levels were by far the most significant causes of the 2001 insolvencies”.
An article in Insurance Day (“US p/c reserve shortfall $120bn”, October 3, 2002)
“NEW report estimates the US property/casualty industry has a reserve shortfall of up to $120bn, close to the levels seen in the mid-1980s, writes Claire Wilkinson, New York. According to Alice Schroeder, property/casualty analyst at Morgan Stanley, this represents about 41% of the industry’s surplus at year-end 2001."
The commission appears to have adopted the view that management ignoring advice and deliberately booking substantially low reserves and charging substantially low prices, largely explains chronic massive under-reserving and under-pricing. Yet two independent experienced and eminent actuaries give estimates of reserves, 12 months apart that differ by $5.3 billion. Is it not immediately evident that the principal explanatory variable of the collapse is the assessment and estimation of reserves?
How do we prevent future collapses? We need to understand why HIH, and many other companies in the same boat, were chronically and massively under-reserved and underpriced so that this phenomenon does not happen again.
HIH was chronically and massively under-reserved and under-priced because it failed to analyze, assess quantify and recognize one of the critical risk characteristics of a long tail line of business, namely, superimposed inflation. [There are other technical reasons, but we do not deal with them in this article.]
I realize that this explanation of the root cause of the collapse is not terribly “sexy “and accordingly does not make for good sensational press. But, it reflects the reality.
The aims of this article are many-fold. It debunks pervasive myths surrounding the HIH collapse including the so called $5.3 billion loss; deals with both the why and how components of the cause of the abrupt collapse; shows that HIH acknowledged underreserving in its own words in a document made available to the public in 1998; explains why HIH was cash flow positive for many years before running out of cash abruptly; demonstrates that the impending collapse could have been detected from the HIH financial accounts of 31 December 1997, and even earlier financial accounts; shows that once a collapse is in progress for several years it becomes unstoppable; relates the collapse in a global context to other insurers going to the wall; relates the global crisis in long tail liability insurance to analogous financial markets events in the early 90s and discusses measures that should be implemented to prevent future collapses.
Employing empirical evidence, and simple analytical tools, we describe how a collapse in progress can be identified and show that HIH had been marching inexorably in the past 15 to 20 years towards its ultimate fateful day of ruin, just like many other companies around the world, for essentially the same reasons. The arithmetic and algebra is not beyond year 10 mathematics level- it is not rocket science. Some of it can be regarded as a brainteaser on an IQ test.
The technical section has been relegated to the end of the article, for the interested reader. It describes, inter alia, a simple but practical and powerful formula that can be used to detect a “likely” collapse in progress. The formula is based on three figures taken from the financial accounts of an insurer (writing long tail liabilities), a set of numbers provided to the Australian Prudential Regulation Authority (APRA) by the insurer, and most importantly an understanding of the salient risk characteristics of long tail liability lines of business.
Why the HIH exponential “snow-balling” failure in progress was not in the radar sights of APRA is beyond my comprehension.
Did poor corporate governance or corporate malfeasance cause the collapse?
Colleen Ryan (“Did this domino have to fall?” Weekend AFR August 10-11, 2002) argued that if the HIH Royal Commission was never established then “an enormous wake-up call to the business community in terms of the need for corporate governance may never have been delivered.”
However deserved that wake-up call may be, poor corporate governance or corporate malfeasance did not cause the collapse of HIH. Payments made to Brad Cooper, gifts showered on Ray Williams’ staff and monies spent on award winning Christmas parties are not even items in the $5.3 billion loss calculation!
Professor Tom Valentine wrote, “A royal commission is not the appropriate vehicle to analyse problems raised by the HIH debacle” in an article in the AFR on Friday May 25, 2001 entitled, “Making inquiries and getting to grips with HIH”. It appears Professor Valentine contention was right on the button.
This is echoed by Warren Scott’s sentiment below in respect of what we have learnt so far.
“WELL, we're having the HIH Royal Commission we had to have. ……But what have we learned about why HIH went bankrupt or how it could have been prevented? Not much, so far…The US Congress has held two hearings on corporate collapses in Enron and World Com and has already passed new legislation.”, wrote Warren Scott in “Truth hidden by carnival of villains” (Australian, August 19, 2002).
In respect of “..how it could have been prevented”, the commission sought submissions on May 22, 2002 “..ON CORPORATE FAILURE REMEDIES”.
“We are advertising nationally this week asking for considered submissions from interested people and organizations on what might be done to prevent an event like this happening again.”
How does this call for submissions relate to the commission’s terms of reference?
“We appoint you to be a Commissioner to inquire into the reasons for and the circumstances surrounding the failure of HIH prior to the appointment of the provisional liquidators on 15 March 2001”.
Sound remedies can only be determined if you understand “reasons for failure”. Am I over simplifying?
Incidentally, the HIH collapse is not even remotely connected to the Enron, WorldCom or One.Tel type failures, where corporate malfeasance was a key issue.
Was the so-called $5.3 billion “loss” spent and/or did it disappear?
The amount of $5.3 billion, the so-called loss, did not disappear and was not spent. It is a “non-cash” item. On the contrary, it represents revenue not collected. The $5.3 billion loss resides with the long tail liability policyholders.
If the loss had been $10 billion or $2 billion instead of $5.3 billion would the cause and problem be any different?
If the so-called loss had been $10 billion or $2 billion, instead of $5.3 billion, the problem would still be the same. No extra time, effort or money would be required to determine the cause (both the why and how) of the collapse.
So what is this $5.3 billion “loss”, where is it and did anyone know about it?
No one knew about the $5.3 billion “loss”, and the long-tail liability policyholders have the money. That is, the $5.3 billion represents monies not collected from the long tail liability policyholders. Why does the commission not look there?
How could anyone have known about it if it is just the difference between two estimates of claims incurred in past years and payable in future years, given by two independent actuaries, almost 12 months apart, who disagree with each other? Perhaps some knew about a “loss” of several hundred million, but not $5.3 billion.
The $5.3 billion loss is thus a calculation on a piece of paper, nothing more. In order to explain the so-called $5.3 billion loss, we first need to explain what is a long tail liability.
A general insurance contract is usually for one year (risk period). However, the insurer’s liability might not necessarily cease at the expiry of the one-year risk period. This is because there are delays in reporting claims and subsequently settling claims. Accordingly, the insurer may take many years to discharge its obligations assumed under the policy; for some long tail lines in excess of 20 years!
This means that HIH is liable for many claims (in respect of its exposure to prior years) that have not yet been settled, or in some cases, even reported to it. It is the job of the actuary to estimate the insurer’s outstanding claim liabilities, called the reserve, and advise on an allowance in the balance sheet – the provision. Often the provision or the outstanding claim liability is the largest item in the balance sheet. It represents an obligation by the company, in respect of the current and all prior risk years that it will discharge (perhaps) over the next 20 years.
Some illustrative examples with numbers are given below in the technical section. Some readers, especially if arithmetically inclined, may want to read that section next.
The HIH accounts of 30th June 2000 showed net assets of $952.8 million and outstanding claim liabilities (discounted) of just over $4.4 billion. Soon after (and perhaps even before) the accounts were published, HIH found it difficult to meet its claim payment obligations in respect of the 2000 and all prior risk years, as it ran out of “cash”.
In March 2002 the liquidator stepped in and soon after argued that the company was under-reserved as of the 30th June 2000 accounts, and the reserves should have been $5.3 billion higher.
Two widely differing estimates of outstanding claim liabilities
The $5.3 billion dollar loss is the difference between two valuations (estimates) of outstanding claims liabilities. One estimate, a tad over $4.4 billion, is based on a valuation conducted by David Slee, the actuary for HIH, (and appears in the HIH accounts as of 30th June 2000). The other estimate, of $9.7 billion, is based on a valuation conducted in the second quarter of 2001 by Richard Wilkinson, the actuary for the liquidator. Essentially Richard Wilkinson argued that HIH was under-reserved by $5.3 billion. The arithmetic is simple, no company can be under-reserved by 50% one year and be adequately reserved the year before. So under-reserving must have been chronic, and very unlikely to be to due to a major change in claims escalation rates in the last several years. See the section: A scenario leading to a cash crunch towards the end of the article.
In actual fact the $5.3 billion difference is a misrepresentation of the difference in the two valuations. That is because Richard Wilkinson's estimate of total reserves of $9.7 billion is undiscounted and David Slee’s estimate of total reserves of $4.4 billion is discounted (according to my understanding). Furthermore, the $5.3 billion represents the sum of $3.6 billion and $1.7 billion where $3.6 billion is the mean, and $1.7 billion is what the actuaries call a prudential margin. The $9.7 billion estimate is the 75th percentile undiscounted. The $4.4 billion estimate is discounted and is allegedly the 50th percentile. So the difference in mean estimates whether discounted (Wilkinson's discounted equivalent of $8.1 billion- $4.4 billion) or undiscounted ($8.1 billion - Slee's undiscounted equivalent of $4.4 billion), is less than $ 3.6 billion.
The $5.3 billion, or whatever the appropriate lesser amount is, represents premiums that were not charged to the long tail liability policyholders. The premiums were woefully low. If Richard Wilkinson’s estimate of outstanding claims liabilities had been $12.7 billion (instead of $9.7 billion), then the “loss” of $8.3 billion still represents monies not collected from the policyholders and the cause of the collapse is the same (though it may have been recognized earlier).
Two highly experienced and reputable actuaries give estimates of outstanding claims liabilities that differ by about $5.3 billion, based on essentially the same data. When challenged by the Royal Commission to explain this enormous discrepancy, the actuaries can offer nothing better than: different assumptions and that the other is wrong. If you were running a company, and received those two assessments, whose advice would you take? Would you ask for a third opinion? After all, it is common knowledge that you “don’t take two sextants to sea”. How could you be criticized for accepting the lower value, when the actuarial experts cannot agree?
Parenthetically, I believe that accounting for the huge discrepancy of $5.3 billion in the two independent valuations to different superimposed inflation rate and discount rate assumptions, is a gross over-simplification.
Is one of the two independent widely differing estimates of outstanding claim liabilities credible?
Neither is credible in my opinion. Each actuary thinks the other is wrong. I agree with both of them.
Each actuary uses volumes of actuarial professional judgment.
It is my professional judgment that the volumes of actuarial judgment applied by both actuaries is very much at odds with the risk characteristics of the business. This means we still do not have a reliable estimate of the “loss”.
[Footnote: The commission has invited me to “address at least the following: Manner in which, and extent to which, use of the scientific paradigm reduces or eliminates the need for exercises of judgment”.]
Could the HIH collapse have been stopped if detected many years ago?
No. The proverbial horse had bolted. The prior years had been written and future inflation impacts on them. The company would not have had sufficient surplus (capital) to upgrade reserves perhaps by a factor of two. Any other minor strengthening of reserves in the last few years, non-discounting of reserves (superimposed inflation was very high anyway), new Australian Prudential Regulation Authority (APRA) capital requirements or (optimal) reinsurance arrangements would not have arrested the “losses” and saved the company. It was already insolvent, with the cash crunch still to come.
“It appears that HIH under-priced its risk protection. If this is the only problem, the collapse has to be attributed to bad management rather than to something more sinister”, wrote Professor Tom Valentine in the article published May 25, 2001 mentioned above.
The “bad management” of HIH was in fact bad risk management especially of technical issues involving pricing, reserving and reinsurance of its own risks. It was not corporate malfeasance. See the quote above from Best Week P/C regarding 2001 insolvencies and the section below entitled Undetected superimposed inflation-a principal reason for chronic and massive under-reserving
Did HIH acknowledge the “decline in adequacy” of past reserves and possible “significant strengthening” of future reserves in a document in the public domain?
HIH acknowledged its own under-reserving in words (not just numbers) in the HIH Winterthur Memorandum (1998) offering shares to the public. The Memorandum is based on the accounts as of 31st December 1997. The document disclosed information regarding past reserve inadequacies and possible significant reserve increases in the future that is rarely included in financial statements of insurance companies. In my view it predicted its own demise. Yet the shares were over-subscribed! What does this say of investment analysts’ interpretation of financial accounts of an insurer writing long-tail liabilities?
Here is an excerpt from the Memorandum:
“The decline in the adequacy of claims provisions in recent years has been due to the larger than expected adverse development of certain long-tail portfolios, including the workers’ compensation and liability portfolio. The Company incurred underwriting losses in 1997 primarily as a result of …Such losses are continuing and although specific measures have been taken in respect of these classes to reduce ongoing losses, a significant strengthening of reserves may be required”
The following remarks are pertinent.
- The “decline in the adequacy” means that the current liabilities in the balance sheet under-forecast what was paid in the next twelve months. See calculations in the technical section.
- The term “adverse development” refers to development due to random fluctuations. Repeated “adverse development” is indicative of non-recognition of an inflationary trend. Lead Counsel Wayne Martin QC appeared to be on the mark when he declared "reserve strengthening had been required for every year of account since 1992, and the chances of that occurring on a random basis were somewhere in the vicinity of 2 to the power of 16 or 2 to the power of 17”. See Reference [1] below for more details.
- The only way to “reduce ongoing losses” incurred in the current and a prior risk year is by going into liquidation. That is because superimposed inflation, a calendar year effect, impacts on all the prior risk years. HIH seems to have ‘predicted’ its own demise.
- If 15% represents “a significant strengthening”, it amounts to $300 million increase in reserves and a decrease in surplus from $550 million to $200 million.
Sections 8 and 9 of reference [1], which appears on the commission’s website, present more details and arguments indicating that the company was more under-reserved than acknowledged in the Memorandum. These arguments are based on the reserving methods described in the Memorandum.
In what follows, we give alternative arguments for chronic and massive under-reserving.
Undetected superimposed inflation- a principal reason for chronic and massive under-reserving
The main reason that Dr Alan Greenspan, Chairman Federal Reserve (USA) and Ian MacFarlane, Governor Reserve Bank, focus on maintaining a low level of economic inflation is due to its geometric (exponential) effect on prices.
“The arithmetic makes it plain that inflation is a far more devastating tax than anything that has been enacted by our legislature. The inflation tax has a fantastic ability to simply consume capital” (Warren Buffett).
Inflation consumes capital exponentially
In long-tail liabilities, there is another type of inflation called ‘superimposed’ or ‘social’ inflation. This sits on top of economic inflation. Dr Alan Greenspan and Ian MacFarlane have very limited influence, if any, on this kind of inflation. It is principally driven by the social environment in the year in which the payment is made.
One of the main points of difference between the two actuaries is superimposed inflation. David Slee did not think it was necessary to make allowance for superimposed inflation. Indeed, he found negative inflation (deflation) in the Professional Indemnity (PI) line of business from 1990 to 1996. This seems a very odd finding when my PI premium has just increased six fold and PI and PL (Public Liability) premiums are rocketing worldwide. Richard Wilkinson used his experience and judgment to arrive at a figure of 4% per annum. Neither appears to have considered the evidence within the data itself that could allow them to come to an agreement.
Yet failure to recognize the superimposed inflation rates in the HIH businesses was a principal driver of its collapse, according to my analyses. Most importantly, superimposed inflation rates cannot be assessed and quantified using professional actuarial judgment.
HIH had a high exposure in areas where superimposed inflation has played a devastating role, especially the London Market where for some lines of business including public liability superimposed inflation has been in excess of 20% per annum over the last 10 years; and Workers’ Compensation in California, for some companies in excess of 20% per annum in the last 10-15 years. Note that these high inflation rates have been in the business for many years but were very unlikely to be recognized by the company.
It would have been difficult to do much better in the days of the slide rule, when the standard actuarial (non-statistical) reserving methods were invented, but much more can be done nowadays given the advent of fast computers and new statistical risk assessment modelling techniques.
Is the collapse of HIH part of a global phenomenon?
The collapse of HIH is not an isolated failure on the global scene. Indeed, it is not even an isolated case in Australia. In Australia UMP collapsed for the same reasons. The list of collapses and major reserve upgrades around the world is almost endless. Some non-life insurers have reported reserve upgrades as high as US$2.7 billion, but they had sufficient surplus (capital) to continue operations. HIH did not. St. Paul Insurance Company was the largest writer of medical malpractice until it ceased writing it this year. Australia has also experienced a medical malpractice crisis. Premium rates for Employers Liability, Professional Indemnity and Public Liability are rocketing around the world, not just in Australia, as companies started recognizing their under-reserving and under-pricing. The UK, in particular, is currently experiencing an escalating crisis over Employers Liability cover. Premiums are soaring and sending some small businesses to the wall.
Recall that Best Week asserts: “Inadequate reserves, improper pricing and unsustainable growth levels were by far the most significant causes of the 2001 insolvencies”. See also excerpt taken from Insurance Day above regarding massive under-reserving in US.
The financial markets experienced a similar chain of events in the early 90s. Some of the world’s largest financial entities (Orange County, Barings…) lost billions of dollars as a result of poor risk management. This triggered a revolution in the methods used to assess market (investment) risks. The various regulatory authorities converged on Value-at-Risk (VaR) as an acceptable measure of risk. This triggered a revolution in risk assessment of market risks.
Remedies for preventing future collapses
What is needed in the general insurance and reinsurance markets is a revolution in assessing and reporting long-tail liability risks that parallels the revolution that is taking place in assessing market risks.
Due to the advent of fast computers there do exist statistical methods that facilitate the assessment and quantification of the salient risk characteristics of a long tail liability line of business, including superimposed inflation and variability.
Not knowing the inflation and variability in your own business is courting disaster. It may be noted here that two companies writing the same line of business in the same state can have different inflationary and variability experiences. There can be no substitute for an objective analysis of historical data from one's own business.
In summary, appropriate statistical modelling is the best remedy to prevent future collapses, while improved accounting standards and better corporate governance may at best only lead to earlier acknowledgement of a failure in progress.
Transparency can also help prevent future collapses. In the USA, the National Association of Insurance Companies (NAIC) and, in the UK, the Department of Trade and Industry (DTI) (to a lesser extent) make schedule P data (equivalently, loss development arrays) available to the public, for a fee. I believe it should be incumbent on the Australian Prudential Regulation Authority (APRA) to adopt the American model of collating schedule P loss development data (triangulations) and other relevant data on a yearly basis, for each line of business, for each company, making it readily available to anyone for a fee. This way APRA, rating agencies, brokers and any other organization can conduct their own independent assessment of the adequacy of a company’s provisions as set out in the balance sheet.
All true remedies must be preventive as a collapse in progress is increasingly impossible to stop.
Want to know more after reading this article?
The report I submitted to the Commission in September 2001 has recently been made
available on its website. See web page listed under
Those readers who are more algebraically inclined may wish to read the reminder of this article, which examines how a company can be cash flow positive for many years before running out of cash abruptly, and provides some simple formulae for detecting a “likely” failure in progress.
Technical section
Let us study a long tail liability line that is evaluated at the end of 1983 and was first written for the 12 months calendar year 1980. We will assume that the insurer has no expenses and zero investment return and charges the same total premium of 100 each year. We also assume that each risk year generates the same run-off paid development pattern
For a cohort of policyholders insured for the 12 months period in 1980, a premium of 100 is collected at the beginning of the year.

During 1980 the insurer pays 10 in claims. At the end of 1980 it has 90 (=100-10) in cash. Out of the 90 in cash it provides (reserves) 80 for claims it will have to pay in calendar years 1981, 1982, … for accidents incurred in 1980. Note that the reserve is an estimate of the future claim payments. So it has estimated a profit of 10 for the 1980 accounting year at the end of 1980.
Now in 1981 it pays 20 in claims and at the end of year reserves 60. So far in respect of 1980 risk year it has paid 30 in claims. So at the end of 1981 in respect of the cohort insured in 1980 it has 70 in cash.
By the end of 1983 the company has 46 in cash of which 36 is in reserve.
Now for the 1981 risk year it also writes a number of policies, that can even be the same cohort as 1980. (Recall these policies are only one-year policies). Suppose further that the risk years 1981, 1982 and 1983 generate the identical pattern of paid losses as 1980.
Let’s now examine the 1981 risk year.

At the end of 1983, in respect of the risk year 1981, the company has 56 in cash of which 45 is in reserve.
And now for the 1982 risk year:

At the end of 1983, in respect of the risk year 1982, the company has 70 in cash of which 60 is in reserve.
And for the 1983 risk year;

At the end of 1983, in respect of the risk year 1983, the company has 90 in cash of which 80 is in reserve.
So at the end of the 1983 calendar year the insurer has 262 (=46+56+70+90) in cash of which 221 (=36+45+60+80) is in reserve.
The total reserve of 221 is an estimate of total claim payments still to be made in respect of risk years 1980, 1981, 1982 and 1983. It is a liability (obligation) item in the balance sheet that will be discharged in the future.
The insurer is cash rich as it collects the premiums at the beginning of each risk year but payments for claims that are incurred in the risk year are largely made after the end of the risk year, up to many years later.
Some would regard a long tail liability line as a great business. It is the only business where you pay at the beginning of the year for a service that may eventuate many years later. If you can invest the cash at a high rate of return you will be making money from OPM. Warren Buffet calls this the ‘float’.
If we group all the accident years together and only show the total claim payments (paid losses) in each period we obtain what the actuaries call a paid loss development array.
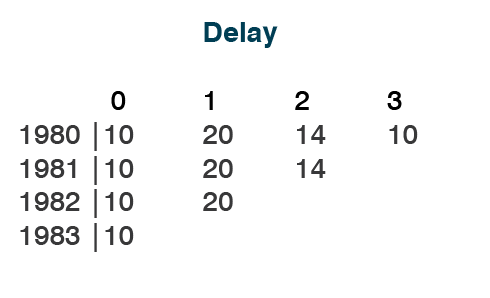
In the above triangle a row represents the development of paid losses for a risk year. Since the claim originates (is incurred) in the risk year, the delay represents the number of years between the risk period (when the claim was incurred) and the period when the claim is subsequently paid. Consider now, say, the last diagonal with values 10, 20, 14 and 10. All these paid losses are made in the same calendar year 1983. The direction of evolution of the paid losses is at 45 degrees to the horizontal (delay direction) and 45 degrees to the vertical (risk year direction). Each year we add another diagonal (calendar year).
Consider the risk year 1980. Can you give a prediction what will be the paid loss in delay 4?
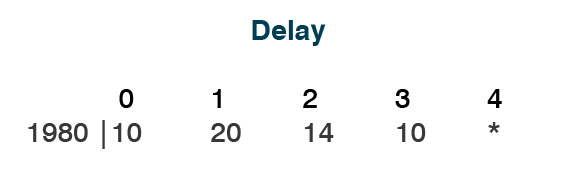
That is, what number would replace the asterisk? You may observe a pattern in the numbers 20, 14, 10. Some may suggest the number is 8. Actually, I tried to make the numbers decrease by approximately 33% per year, so that the decay is approximately 67%.
We now introduce some additional patterns (trends).
Inflation, if manifested in the paid losses would appear as a trend along the calendar years (diagonals). Here are the next two diagonals with approximately 50% per annum inflation
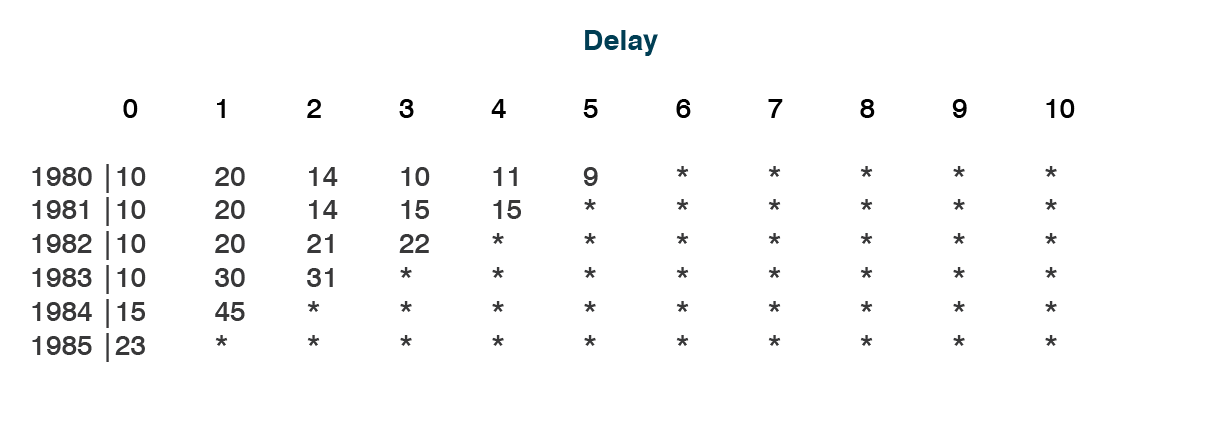
Note that for risk year 1980 the numbers 20, 14, 10 decrease by about 33% per year. So without the 50% calendar inflation the next two numbers would be (about) 7 and 4. The 11 in delay 4 is the 7 increased by 50% and the 9 in delay 5 is the 4 increased by 50% per annum for two years. This means that the tail ‘fattens’ and the resultant trend is now around zero. Inflation impacts the old (prior) risk years. This is axiomatic
The 50% trend along the diagonals also manifests along the delay direction and the risk year direction. As you proceed down each column from diagonal 1983 there is an increase of (approximately) 50% per annum. Also if you proceed to the right along any row from diagonal 1983 there is the 50% trend “added “ to the –67%.
An IQ test may require the candidate to complete the rhombus going to the right of the last calendar year (diagonal) 1985 and up to delay 10. That is, forecast the paid losses where the asterisks are located. The sum of all the “*” represents the total reserve or the outstanding claim liability to delay 10.
You do not have to be a rocket scientist to see that if something like this inflationary trend occurs, continues for many years, and is not recognized when making predictions, even if it is not as drastic as in the example (in fact this makes it more insidious), then the original pricing of 100 for each risk year will not be enough, reserves will be too low and the company will run out of cash abruptly.
In order to solve this problem technically you would have to ‘analyse’ the trend patterns in the three directions, risk year (down each column), delay (across each row) and calendar year (along the diagonals). With real data there would also be random variation about the trends in the three directions. There are statistical methods that can be applied to separate the trends in the three directions from randomness. The final model should project the trends and variability in the paid losses in the future based on the ‘information’ in the triangular array.
How could the impending collapse have been detected?
We now consider quantities that appear in the balance sheet: current liabilities and noncurrent liabilities.
Actuaries classify liabilities “into current and non-current liabilities according to estimated time of payment which has been based on a statistical analysis of payment patterns in prior periods”.
Current liabilities represent those payable in the next 12 months. In the above array, they are the (larger) asterisks in the diagonal immediately to the right of calendar year 1985. The non-current liabilities are paid beyond the next 12 months (the other smaller asterisks). The total liabilities are the sum of the two
Call the current liabilities (discounted) reported in the balance sheet C and corresponding total liabilities (discounted) T. Call the current liabilities (discounted) C’ and the true total liabilities (discounted T’.
Properties of the ratio C’/T’
For a long tail line of business there are a number of characteristics (variables) of the business that impact on the ratio C’/T’, where C’ is the ‘true’ current liabilities and T’ is the ‘true’ total liabilities.
- The variable that has the greatest impact on the ratio C’/T’ is superimposed
inflation (50% in above example). If inflation increases C’/T’ decreases. All
the paid losses going forward increase exponentially.
If inflation is reflected in the balance sheet from year to year, then the current liabilities C’ and the total liabilities T’ increase from year to year according to (at least) the assumed inflation rate. Premiums should also increase to reflect the inflation in (future) underwriting years. (Here we are assuming that exposures do not reduce along the underwriting years).
More importantly, as shown below, inflation has a devastating effect on T’, the total reserve. - The decay parameter which reflects the length of the tail is also relevant in determining the ratio C’/T’. In the above example it was approximately -67% per annum. As the rate of decay reduces the ratio C’/T’ also reduces.
- Discount rates (opposite effect to inflation) also have an impact. As the discount rate increases the ratio C’/T’ also increases.
Typically for lines of business that are relatively ‘short’ tailed with low inflation the ratio C’/T’ can be as high as 70%, but for some long tail lines it can be as low as 9%, (and this is assuming a 6.2% per annum discount rate, as is assumed in the HIH accounts in the Memorandum).
The ratio C/T of 40%, 38% and 39% reported by HIH in the 1996, 1997 and 1998 financial accounts respectively are very high. They are indicative of short tail (fast decay) and low inflation rates.
In Australia I have analyzed portfolios with C’/T’ ratios of 20% (Public Liability), 24% (Workers’ Comp) and 27% (Compulsory Third Party). Ratios for Workers’ Comp US and London Market risks can be as low as 9%, even after assuming a 6.2% discount rate.
Accordingly, the high (average) ratios achieved by HIH should have immediately triggered a detailed investigation of the company. And there is much more.
Suppose a company reports an unusually high C/T ratio and subsequently reports that C under-forecast C’, that is, current liabilities C were inadequate for the next twelve months. We can draw some very powerful conclusions.
Under forecasting means C’=(1+k)C where k>0 . (1)
Call the ratio C/T in the balance sheet R, that is, C/T= R. (2)
The actual ratio C’/T’ is given by,
C’/T’=R’. (3)
By combining equations (1), (2) and (3) it follows immediately that
T/T’= R’/(R(1+k)). (4)
The last equation determines the extent of under-reserving. If R’<R(1+k), the company is under-reserved.
A simple formula, but practical and extremely powerful.
Here is an example. According to the
R=0.39.
The notes to the accounts acknowledge under-reserving in recent years:“The decline in the adequacy of claims provisions in recent years...” (Page 50).
Let us assume that k=0.05, that is,
C’=1.05C (5% inadequacy)
Suppose further that for a line of business, given the high superimposed inflation experience, the true ratio of current to total, R’, is given by,
R’= 0.20.
It follows from equation (4) that:
T/T’= 0.49.
So the company is massively under-reserved for that line. In this case it is only solvent if its reserve to surplus ratio is significantly less than one (very unlikely). The reserve to surplus ratio in HIH’s 31st of December 1997 accounts is 3.6. So even a 10% increase in reserves means a 36% decrease in surplus (shareholders’ equity). But indeed the Memorandum does say: “..a significant strengthening of reserves may be required”.
Formula (4) expresses the degree of under-reserving, and also indicates the devastation caused by superimposed inflation, especially if it is unrecognized in the business.
The ratio T/T’ only represents the under-statement of the central estimate. Once the ratio C/T is too high and C is less than C’, in order for the company to continue in business it would have to have a large surplus or a massive capital injection.
It cannot lower its ratio C/T next year by just lowering C and be adequately reserved. If it reduces C next year to achieve a lower C/T ratio, then C will under-forecast C’ by a larger magnitude, that is, the quantity k in equation (1) increases. If instead, the company increases T-C (non-current liabilities) for the next year, then it will have to increase it sufficiently to achieve the ratio R’. It will not be under-reserved then.
Once a collapse has been in progress for quite a few years, the company cannot recover without having a huge surplus or a massive capital injection.
Note that the ratio of current to total liabilities in the balance sheet is a weighted average across all long tail and short tail lines of business. The weight for each line is its total reserve. This means that HIH’s weighted average of current to total excluding short tail lines may be considerably lower than 39%. For example, if 10% of the total reserve (is short tail) and has an average current to total of 70%, then the ratio of current to total for the long tail component drops to 36% which is still much too high, especially for London Market risks and Workers’ Comp in US.
A scenario leading to a cash crunch
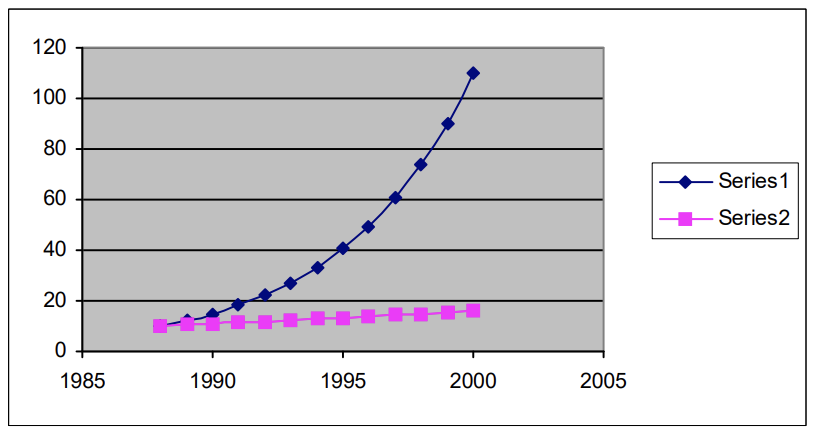
In a Workers’ Comp portfolio in USA superimposed inflation of 20% per annum kicks in 1988, and is stable until the current time 2002. The true ratio C’/T’ based on this inflation rate (and a 6.2% pa discount rate) is 0.2. What happens if the company reports each year for this line of business a ratio C/T equal to 0.4 by assuming a very low inflation rate of 5% per annum in the future, as in the Memorandum.
Graph 1
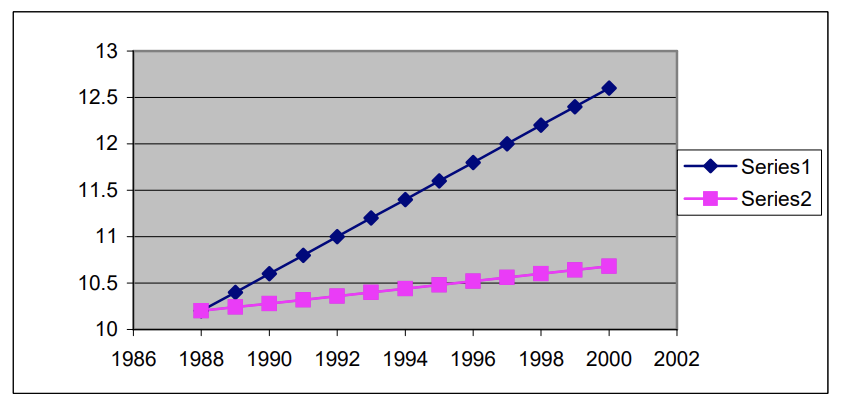
Growth on a % scale
Series 1 represents the inflationary trend of 20% per annum, the trend (increase) in the true current C’ from year to year, the trend in the true reserve T’ from year to year and also what should be the increase in premium from risk year to risk year.
Series 2 is the trend assumption used by the company.
Graph 2
Growth on a dollar scale
On a dollars scale, each year the current ‘true’ paid C’ will grow exponentially based on the 20% pa inflation rate and so will the reserve T’. The balance sheet C and T will also grow exponentially but based on an inflation rate of 5% per annum. The difference (gap) between the two exponential curves increases as time goes on. Each year the company will find that its forecast of current liabilities C is inadequate, just as mentioned in the HIH Winterthur Memorandum (1998). That is, C is less than C’.
At first the company is cash flow positive as it is collecting premiums (that may be woefully too low) at the beginning of each risk year and not paying for claims till much later. The cash crunch comes because C’ grows exponentially, the premiums do not grow fast enough, and each year the reserve may be less than half of what it should be.
Suppose starting in 1996 the company increases C and T by 20% pa each year. It will always continue to be under-reserved by a factor of two. This is because C’ and T’ are also increasing each year by (at least) 20% pa. All the company is achieving is redrawing its trend graph (series 2) from 1996 to 2002 parallel to series 1. It is too late. The proverbial horse in respect of prior risk years has bolted.
Other factors that may have accelerated the cash crunch
The slump in the equities market since March 2000 would have exacerbated the cash crunch.
In respect of HIH’s $450 million finite reinsurance transaction with Hannover Re, HIH immediately recognized an “illusory” $250 million in additional surplus and was effectively discounting twice: on-balance sheet and off-balance sheet.
HIH reported $450 million in reinsurance recoveries (an asset) and the premium “paid” to Hannover Re was $200 million, reported as a liability.
Moreover, HIH was the one that was guaranteeing the interest since the transaction was on a funds-withheld basis. But given HIH was already discounting its loss reserves (6.4% in 30th June 2000 accounts), a significant amount of its future investment income was used to unwind the discount in its loss reserves. Therefore, it didn’t really have much interest income to credit to the funds withheld account.
When it came to the cash crunch the company did not have as much surplus as it recognized in its balance sheet. The additional surplus of $250 million was “illusory”. It did not exist.
REFERENCE
[1] “HIH Debacle: A Global Perspective
A wave of insurance companies going to the wall as a result of high inflationary trends and high variability in long-tail liabilities.” HIH Royal Commission website
Ben Zehnwirth is Managing Director of Insureware. He has held positions as Associate Professor of Statistics and Professorial Fellow of Insurance. He has extensive experience in reserving, pricing and reinsurance of long tail liabilities for clients worldwide including insurers, reinsurers, brokers (retail and wholesale) and consultants. He has published many papers in international journals, including several criticizing the standard actuarial methods for loss reserving of long tail liabilities. His 1994 paper on probabilistic modelling of loss development data including statistical methods for estimation of superimposed inflation is used by the Society of Actuaries (USA) in its teaching program. Ben’s submission to the HIH Royal commission is on the commission’s website, on the fpd submissions page, under the title “Insureware Pty Ltd”.