Statistical analysis of Tower Group A.M. Best Schedule P (2011) data clearly indicates a woeful level of under-reserving
Statistical analysis of Tower Group's year end 2011 A.M. Best Schedule P data reveals alarming reserve health indicators and woeful reserve inadequacy.
In short:
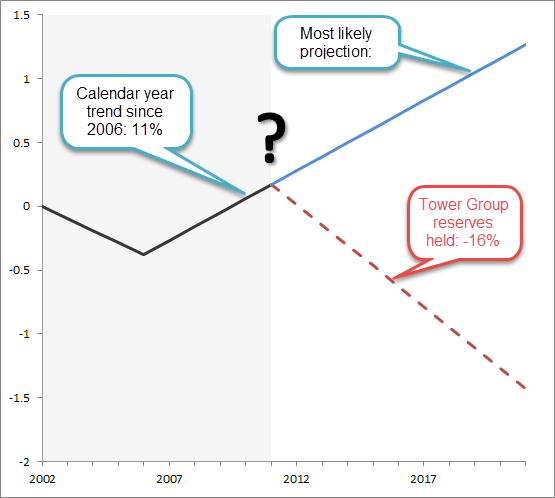
- Inflation (social and economic) of paid losses exceeded earned premium growth by 11% per year for the last five years (2006~2011);
- To reach Tower Group's reserves held and loss ratios - the assumed future calendar year trend must be -16% per year for all future calendar years; and
- There would have been no adverse paid loss experience, had the company identified the model that reflected the salient risk characteristics of the business.
According to Insureware's analyses, further significant reserve strengthening (or upgrades) are very likely. Along with the analysis below, a separate brochure on Tower Group is available here.
Was too much reliance placed on traditional actuarial techniques for long-tail liability losses which were long past their use-by date? Did the company maintain stable loss ratios because it was using Bornheutter Ferguson?
The effective forecast assumptions employed by Tower Group were in complete contradiction of past trends (and volatility).
Significant reserve strengthening was entirely predictable
The ensuing sequence of events were just a matter of time.
- August 2013: Tower Group announced the necessity of reviewing the estimation of its loss reserves and warned of loss reserve hits of $60 million to $110 million.
- October 2013: A.M. Best downgrades Tower Group's rating to B++.
- November 2013: as a result of a comprehensive review, loss reserves were increased by $326.7 million in addition to other restatement adjustments.
- December 2013: Tower Group stock falls further 10% of its workforce are cut.
- February 2014: adverse loss reserve charges were revised from the range $75 million - $105 million to be recorded as $143 million.
Note in January 2014 Tower announced it entered into a Merger agreement with ACP Re – a Bermuda based reinsurance company.
We are concerned reserve upgrades will be required for many years into the future unless the reserving methodology applied to Tower Group's portfolios is seriously revised.
Here's why.
Inflation (social and economic) of paid losses exceeded earned premium growth by 11% per year for the last five years (2006~2011)
The ideal place to begin our investigation is to describe the trends in entire Tower Group data – that is, all lines combined. We perform this analysis after normalising for earned premium on the paid loss development array.
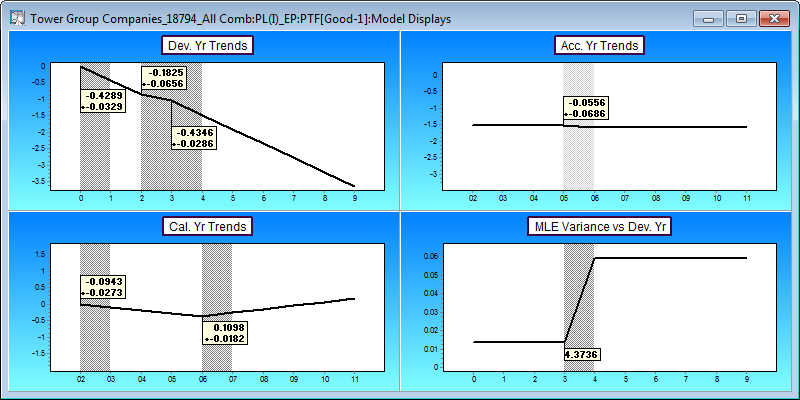
The model for the aggregate of the long tail liabilities is displayed above. We observe:
- The development decay is relatively fast;
- Accident years are stable after adjusting for earned premium;
- Calendar year trends show a 10.98% increase every year since 2006; and
- Volatility increases out in the tail of the development (like one would expect).
It is the third point that is the most critical. As we have already normalised by earned premium, this means that paid losses are increasing faster than earned premium by nearly 11% every year.
Ouch!
To reach Tower Group's reserves held and loss ratios - assumed future calendar year trends must be -16% per year for all future calendar years
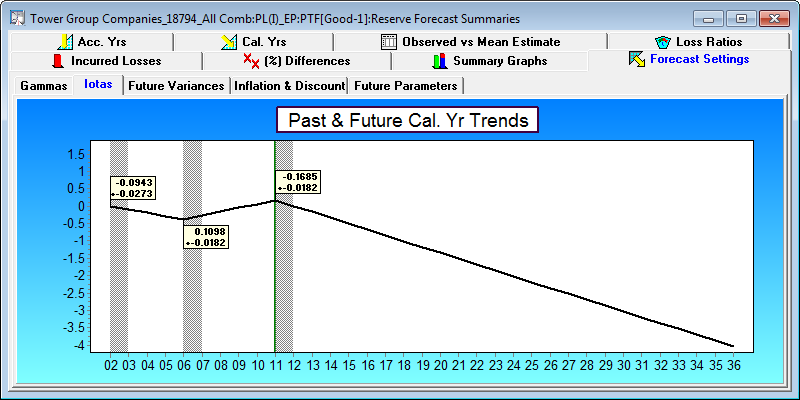
In order to reach the reserves held figure submitted by Tower Group for the data at year end 2011 ($921M), we have to apply the following future calendar year trend assumption (the vertical green line separates the past (left) from the future (right)).
That's right.
The calendar year trend (future inflation: social plus economic) is assumed to be:-16% per year. Not only that, the calendar year trend must be more negative than any previously observed historical calendar year trend over the last ten years.
Were the 11% calendar year trend to continue, under the Tower Group scenario losses would then be increasing faster than premiums by 27% per year!
Accordingly Tower Group's projected calendar year liability stream is far too low
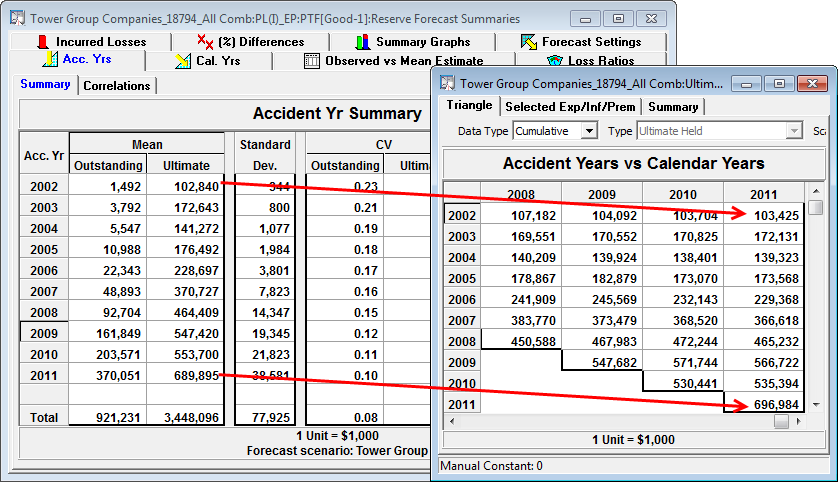
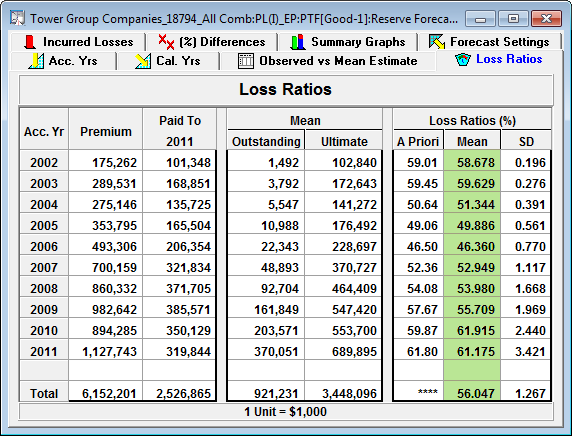
The forecasted liability stream for the -16% trend scenario looks something like the table (below left) below.
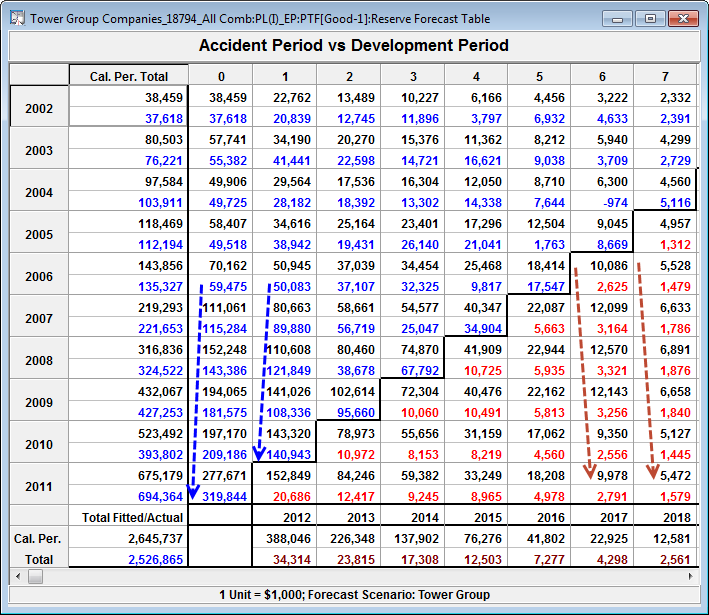
For each observed cell (prior to calendar 2011), we have the pair of observed and model mean values.
For each future forecast cell (post calendar year 2011) we have the projected distribution mean and distribution standard deviation.
Aggregate means are also calculated for the future calendar period (bottom rows) and accident year aggregates (rightmost columns) along with their distribution standard deviations. Calendar year summaries of observed versus fitted are in the column on the left.
In the paid loss data, the losses are increasing across the accident years (blue dashed line) in development years zero and one. However, in the projected data (post 2011) for the development years six and seven (red dashed line), the mean losses are projected to decrease over the same accident years.
Let's compare the projected Tower Group reserve mean with the distributions obtained if the calendar year trend of 10.98%+_ continues.
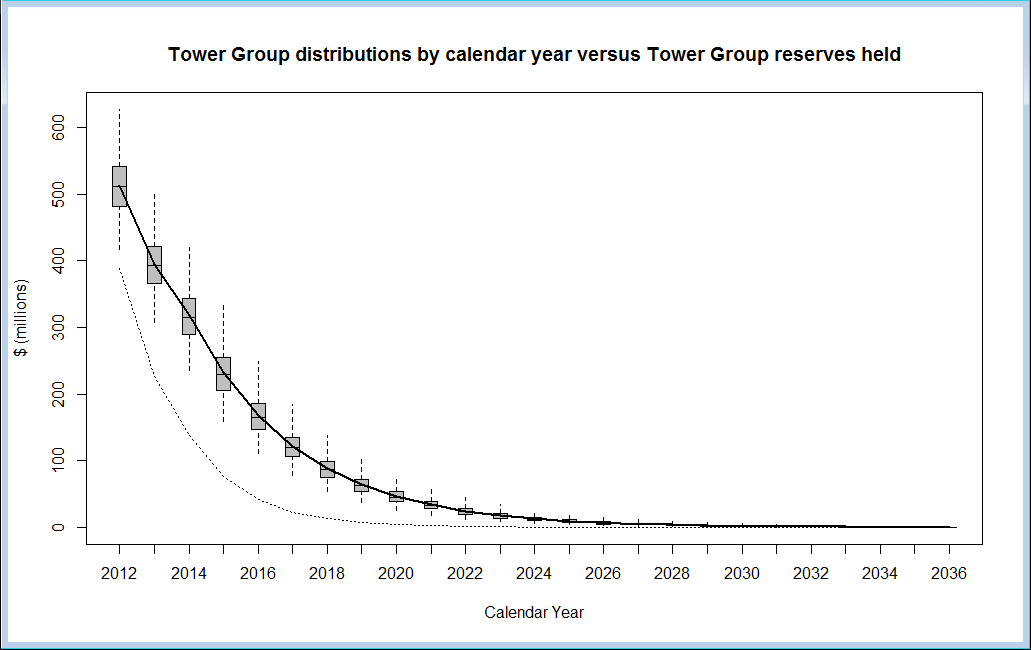
Note the Tower Group mean (dotted line) is well below the forecast distributions assuming the 10.98%+_ trend continues (boxplots with connected means). That the Tower Group reserve mean trend is outside the 1% percentile of this forecast for all calendar years is a further indication of the gravity of the Tower Group reserve deficiencies and that reserve strengthening was inevitable.
Now we compare the resulting cumulative losses by calendar year between the two forecasts.
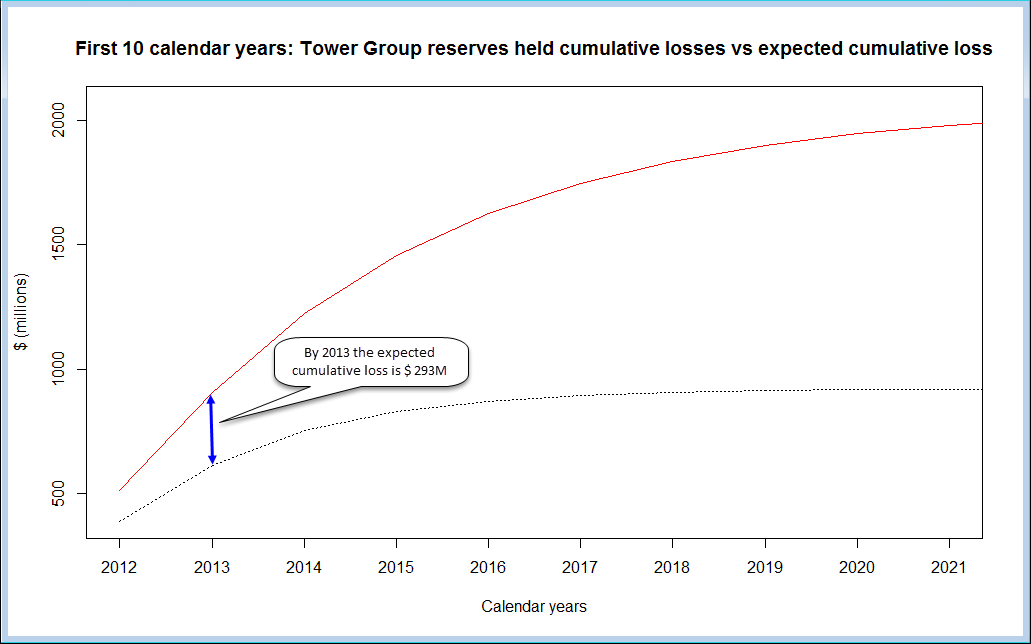
If the paid losses actually followed the 10.98% trend line then we would expect average "adverse development" of $293M by 2013.
This adverse development is not a result of unexpected losses arising from the data, but rather unexpected losses compared to the projected forecast. That is, adverse development arises as a result of poor methodology not truly unusual losses.
Did Tower Group know that in the past there was 10.98% trend and that the future trend required to obtain their ultimates and loss ratios by accident year and total is -16%?
We suspect not.
We show that the ultimates held by Tower Group at year end 2011 match closely with the forecast scenario designed to reach Tower Group's reserve held.
What about the Case Reserve Estimates (CREs)?
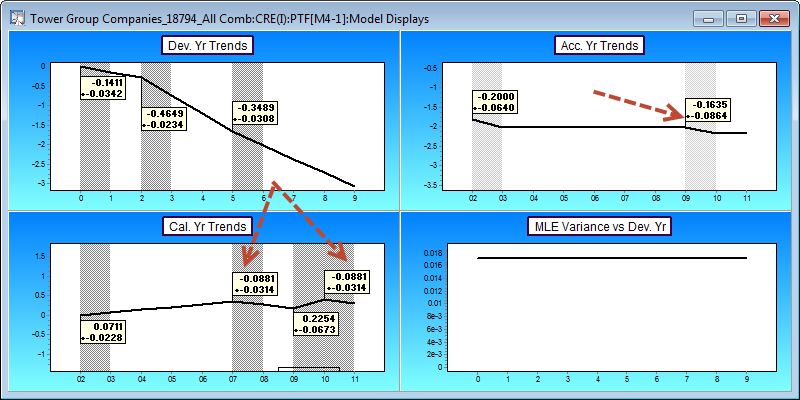
Uh oh.
Let's enlarge that lower display.
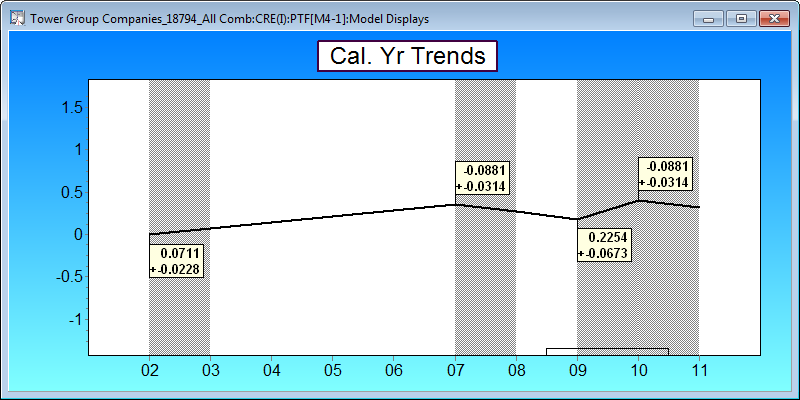
Case Reserve Estimates are increasing over 2002~2007 and decreasing thereafter (calendar year 2009~2010 shows an increase, but is balanced by the decrease in level in the same accident year) by 8.8% per year.
These calendar year trends are in the opposite direction to the losses!!
What about Tower Group's loss ratios?
For the Tower Group scenario, the loss ratios look good. In fact there is no evidence from the numbers that losses are growing faster than earned premium.
The projected reserve losses look plausible compared to the Case Reserve Estimates as the Case Reserve Estimates are also too low!