The Multiple Probabilistic Trend Family (MPTF) modeling framework of ICRFS™ gives:
- one single optimal composite model identified from the data for multiple lines of business and segments
- a company wide picture encapsulating trends and volatility in each line/segment and relationships between them
- the diversification credit based on volatility correlations between lines/segments and any common drivers
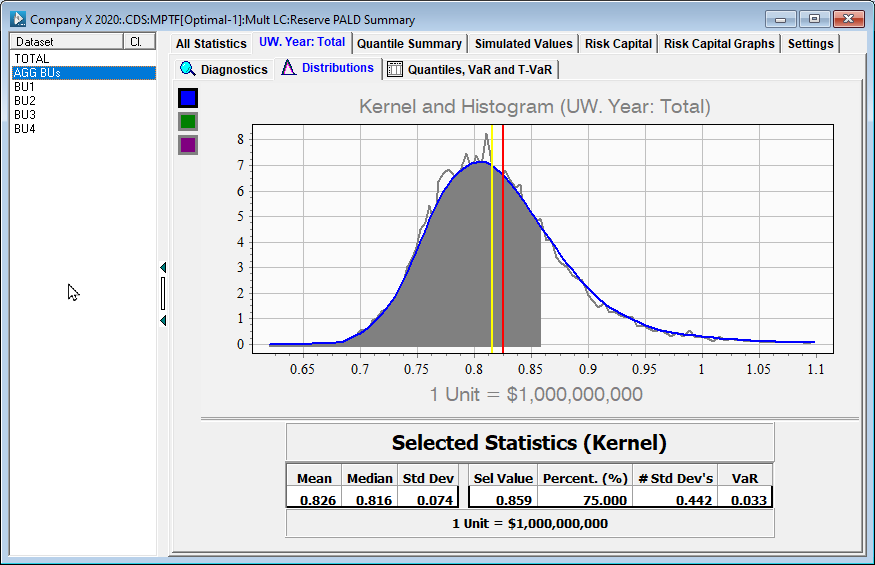
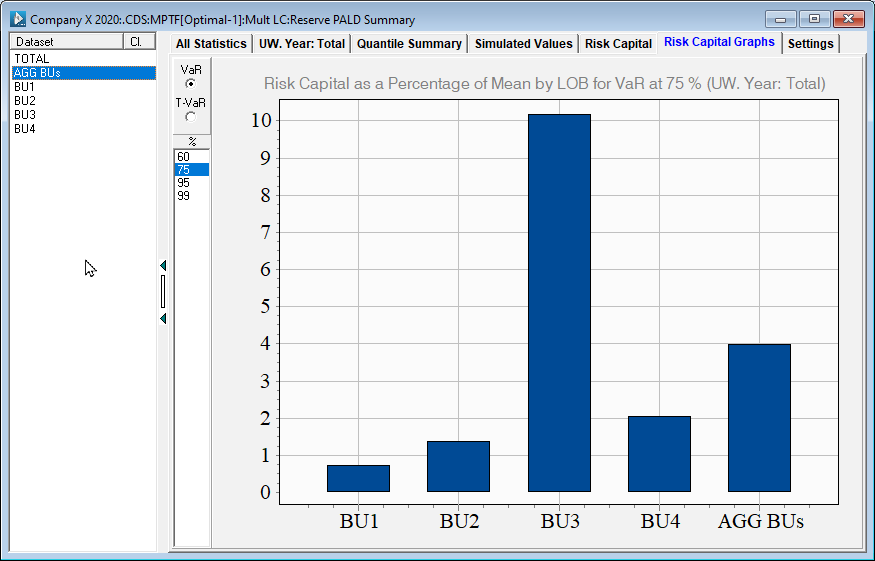
- risk capital metrics for optimal risk capital management - including reinsurance
Access to much information by segment, business unit, or any combination of aggregates with a few mouse clicks!
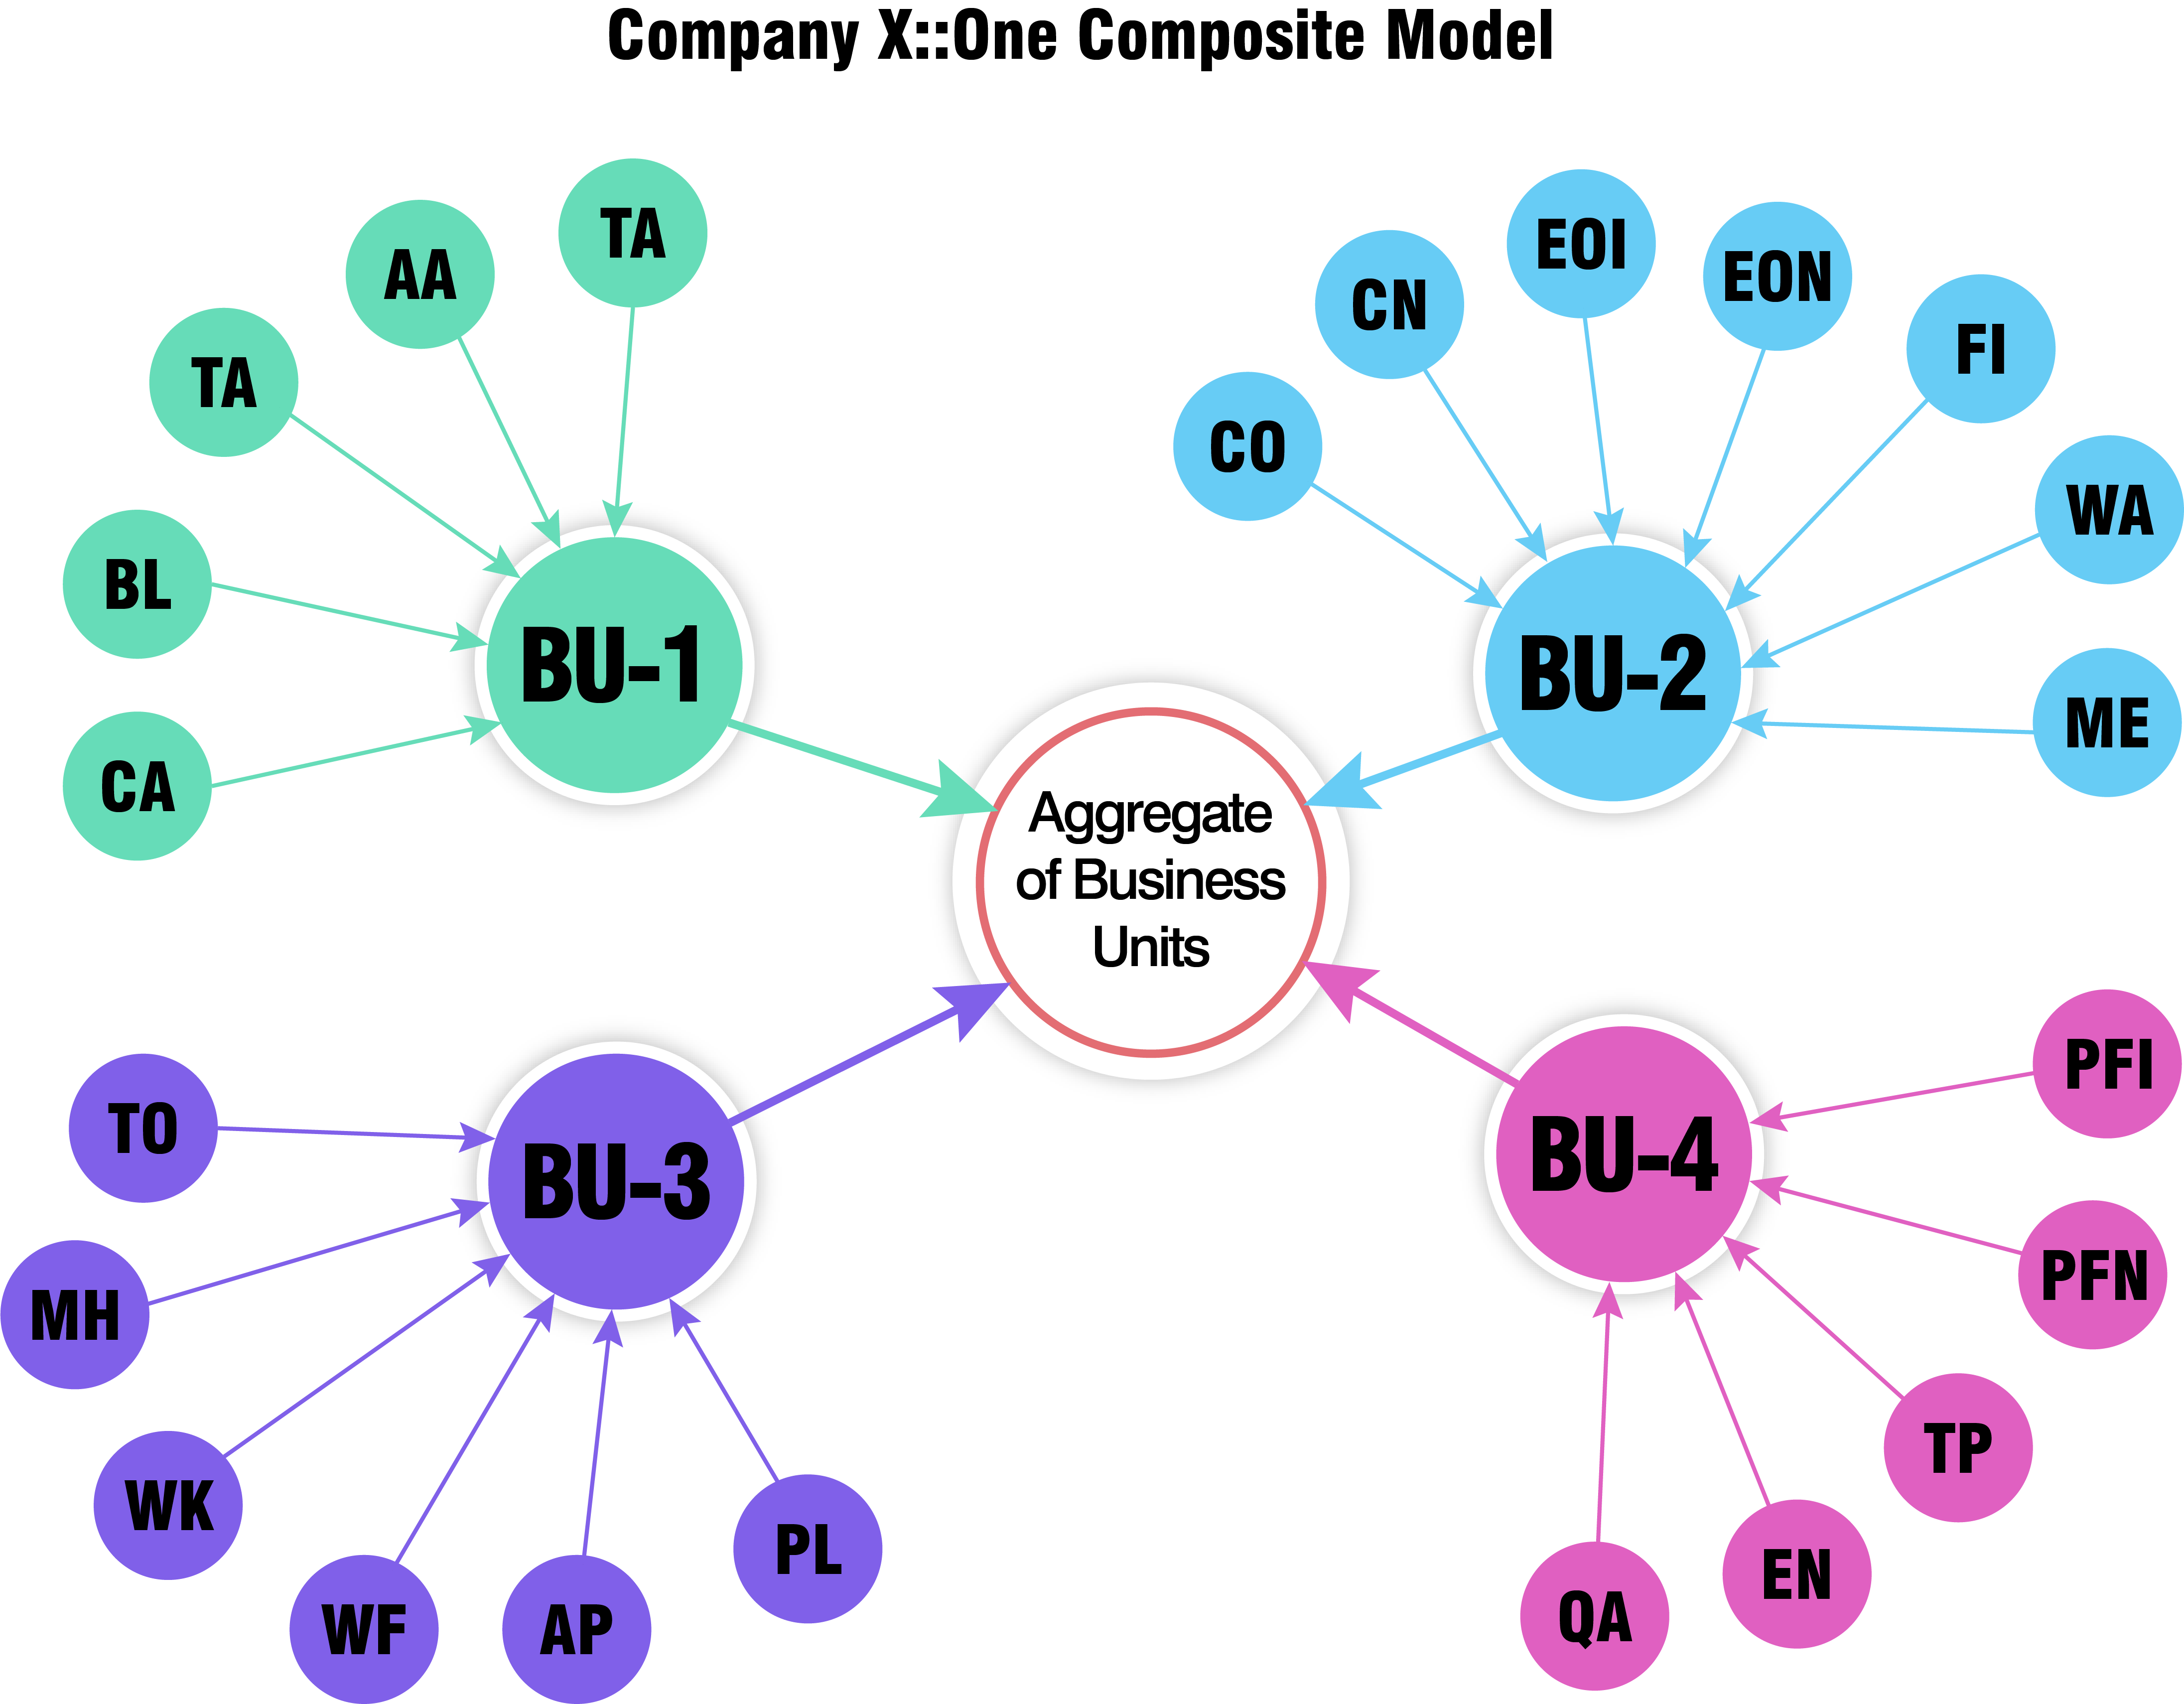
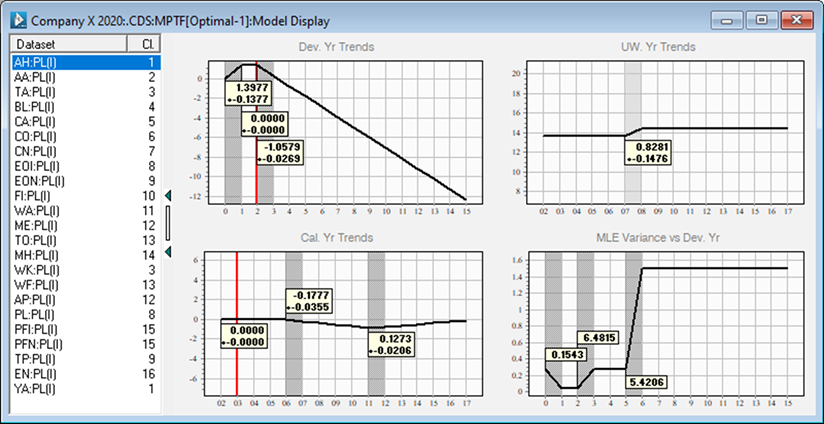
The composite model retains the trend and volatility structure identified for each individual segment. Segments are linked by volatility correlations. Common drivers across segments, if found, form a stronger relationship than volatility correlation as movement in means is a more direct relationship than randomness.
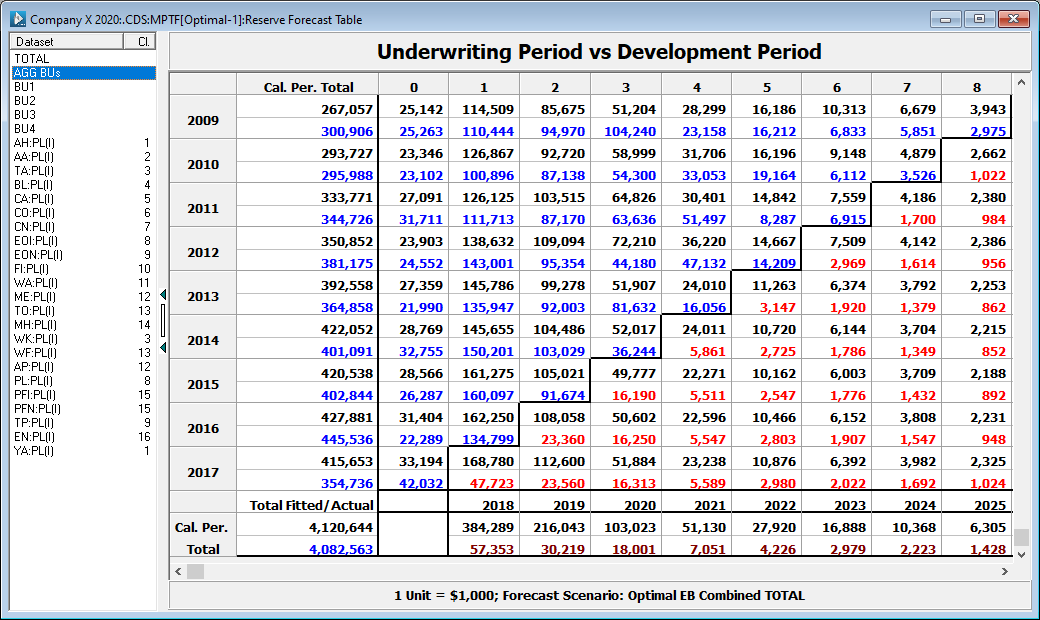
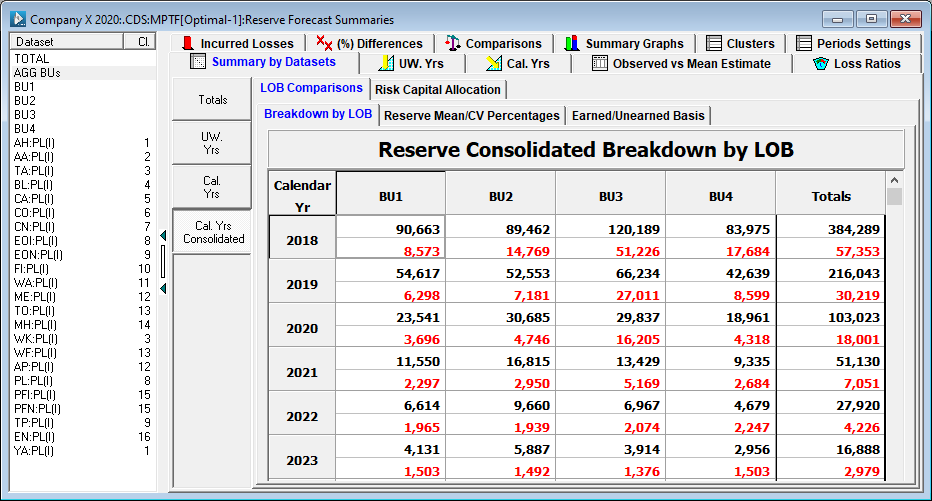
The forecast tables are available for all individual segments, as well as any selection of aggregates, or aggregates of aggregates. As usual, the black numbers are fitted [projected] values, the blue numbers are observed values, and the red [burgundy] values are standard deviations for each cell [total].
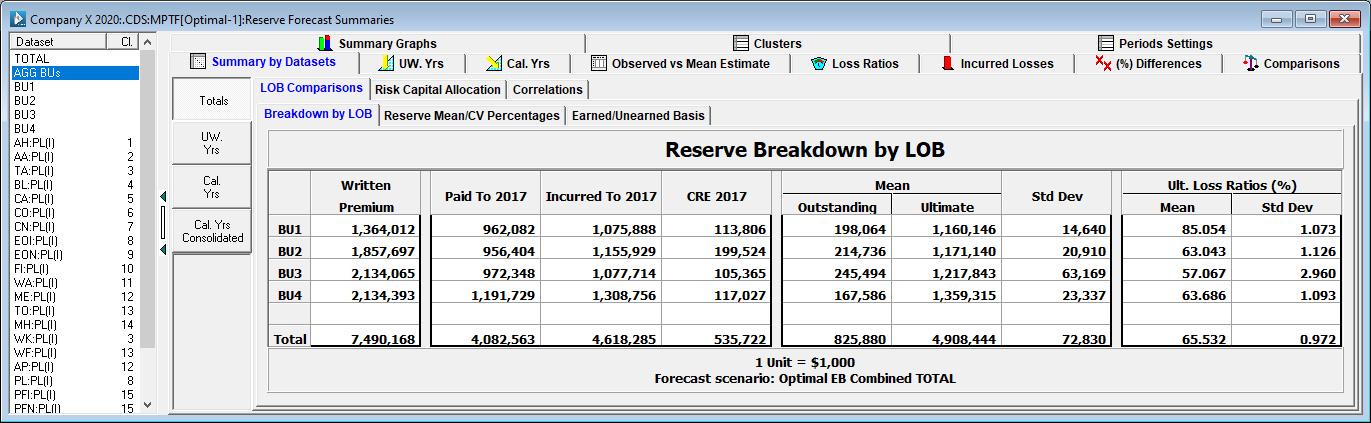
Forecast summary breakdowns are available for each aggregate - and include a number of tables showing allocations into each element comprising the selected aggregate (here business unit).