Long-tail LoB reserving, pricing and
risk capital metrics
…tailored to your company’s volatility,
social inflation and correlation experience.
Read further to see how Insureware’s unique long-tail liability platform, ICRFS™, provides unique interpretable risk insights and can help you:
- Mitigate model specification risk and find the optimal statistical
model for individual lines of business, - design a single composite model for the whole company!,
- measure Calendar year trends, including economic
and social inflation changes, - obtain the right risk metrics for ORSA or Solvency II,
- meet IFRS 17 requirements,
- assess optimal Reinsurance programs,
- calculate reserves net of Reinsurance,
- calculate correlation driven by the data,
- manage Risk Capital,
- price and customize risk transfers such as ADCs and LPTs,
- test link ratio methods graphically and through regression formulations,
- access data for analysis within an easily navigatable database,
- provide robust supporting statistical evidence for loss reserve calculations.
Need to know what risk metrics should be considered?
Sign up for our free risk metrics guide.
One Model. One Truth.
One Source for the Whole Company!
Long-tail liability insurers rely on many sources of data and analysis to manage and
assess risks.
ICRFS™ introduces a new standard in long-tail risk management
— delivering a unified,
enterprise-wide perspective.
Interactive Risk Analyses
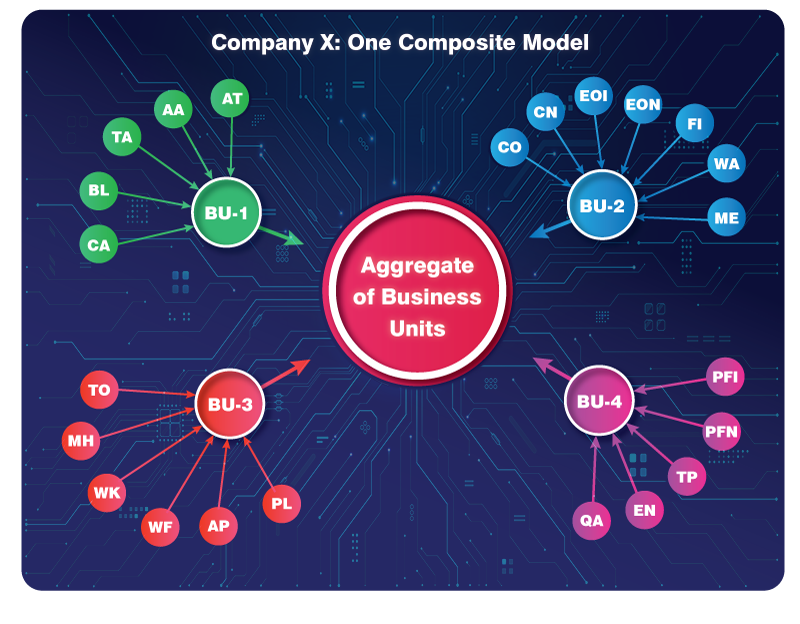
One single composite model output facilitates interactive risk analyses:
- Interrogating myriad risk characteristics of the company with just mouse clicks during boardroom discussions with C-suite executives, chief actuaries, or other stakeholders based on one single composite model output.
- Including what If? analyses at warp speed
A Unified, Data-Driven Risk Model
Our Multiple Probabilistic Trend Family (MPTF) modelling framework identifies
a
single, optimal composite model across multiple lines of business
and segments.
The model is driven by the data, with future forecast assumptions made explicit and
auditable.
ICRFS™ explicitly measures and connects:
- Social inflation
- Impact of law reform
- Process volatility
- Trend relationships between Case Reserve Estimates and Paid Losses
- Emerging risks as they develop
- Common drivers across lines
- Volatility correlations between businesses and segments
The above, with the accompanying forecast distribution metrics, enables a genuinely enterprise-wide understanding of risk behaviour.
A Single Point of Reference for the Enterprise
ICRFS™ establishes a single, consistent point of reference for risk metrics across all lines of business, segments, and business units.
Rather than managing disconnected spreadsheets and competing views, decision-makers assess social inflation, volatility, correlations, and assumptions within one coherent framework — ensuring alignment across actuarial, risk, and executive functions.
Built for Decision-Makers and the Actuaries
Who Support Them
ICRFS™ empowers senior management to:
- Interactively explore and interrogate risk characteristics
- Run what-if scenarios and sensitivity analyses in real time
- Understand the implications of emerging trends before they materialise
For actuaries: trends, volatility and volatility correlations are measured from the data – and future assumptions can be directly connected to historical experience.
For executives: risk capital decisions are supported by a transparent, company-wide model that reflects the true risk profile of each portfolio.
Modelling Wizard for individual lines
A modelling wizard, optimisation algorithms, and comprehensive statistical diagnostics are used to rapidly identify the optimal, parsimonious model.
The model on a log scale is summarized by four charts:
- Development period trends;
- Accident period trends
- Calendar period trends
- Process volatility distributions, that is distribution of data about the trends
- The impact of emerging risks in real time