
- link ratios cannot measure calendar year social inflation
- the assumptions are rarely met by the data
- no insight into trends in the business
- too slow to review
- no connection to the risk characteristics of the data
- no early warning system
- no way to determine whether an answer is good, bad, or ugly
- You can download this brochure here.
The Mack method is a regression formulation of volume weighted average link ratios (chain ladder). The graphical representation and regression formulation means the method can be tested statistically. Other method variants can be included such as different weights, an intercept (Murphy) and an accident year trend for each development year. All these methods are included in the Extended Link Ratio Family (ELRF) modeling framework.
The regression formulation means the method can be tested statistically. If a company is using link ratio based methods, it is critical that actuaries verify the assumptions apply for the company’s data.
In the Probabilistic Trend Family (PTF) modeling framework, we identify a parsimonious model describing the trends in the three directions (development, accident, and calendar), along with the volatility about the trend structure.
Unlike other actuarial solutions, a PTF model is not pre-defined but rather is tailored to each company’s data. This enables the tool to extract the salient statistical features of any loss development array and produce meaningful results for all aspects of the liability distributions. Any modeling assumptions can be tested and verified that they are supported by the data.
All the data in the studies below can be downloaded here: spreadsheet 7 Reaons Data (20 KB) . Case study videos are included below.
Link Ratio Methods residuals trend down: projections too high
Consider anonymized Paid Loss data for an Auto Insurance provider (segment: Bodily Injury).
The display on the right shows a strong downward trend in the residuals (trend in data minus trend in method) versus calendar year.
This means a link ratio method will grossly overstate the reserve estimates. The Mack method (volume weighted average) gives a total reserve of 902M. The arithmetic average link ratios gives a total reserve of 1.16B.
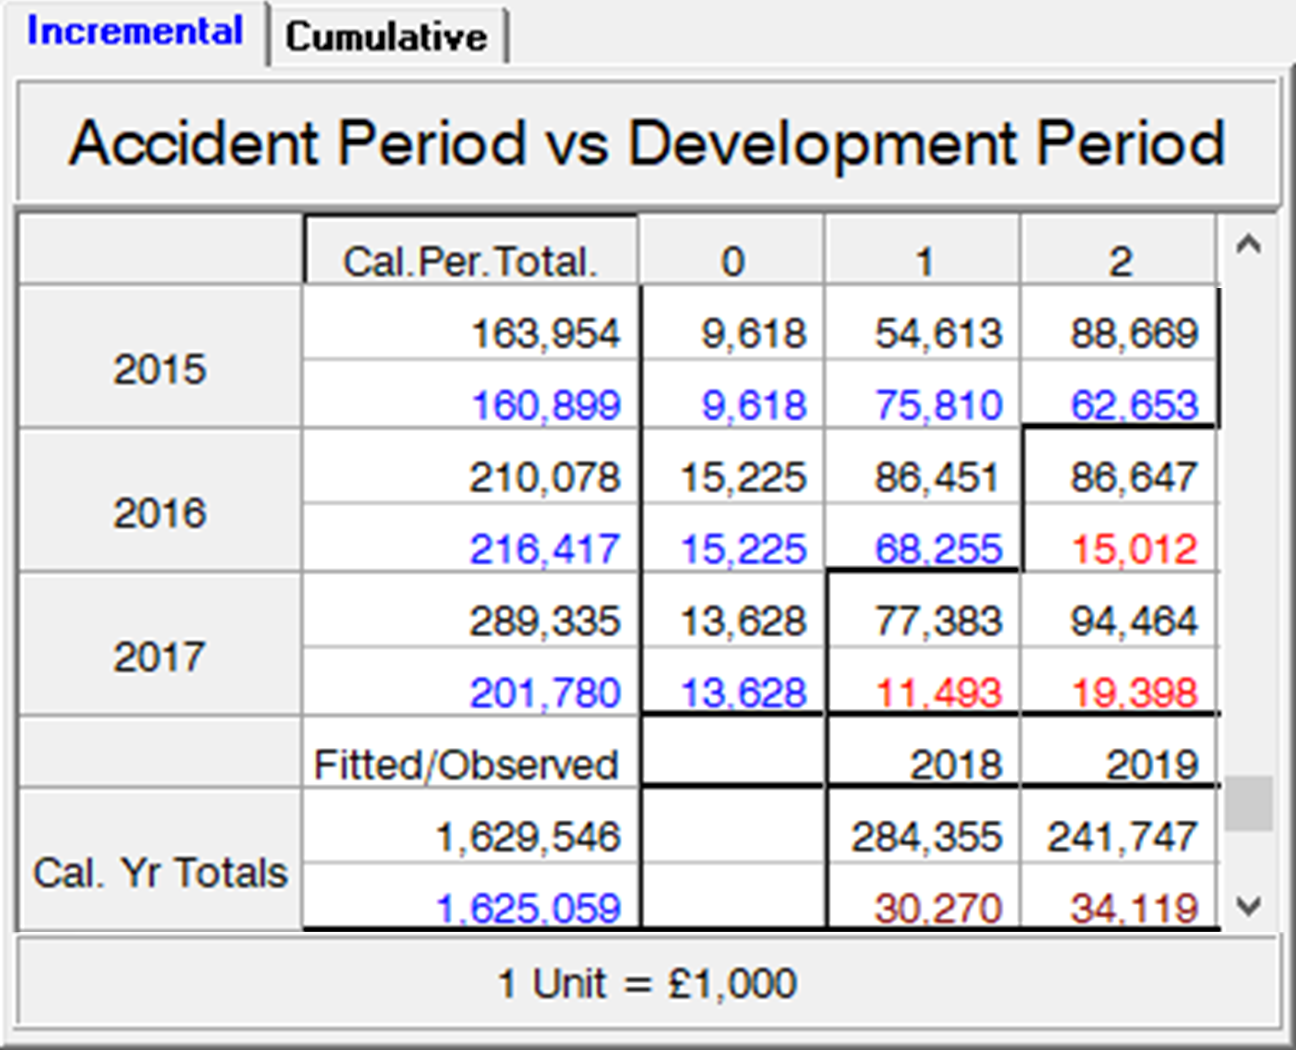
On the left is the forecast table (incremental version) for the Mack method.
The company just paid 202M GBP in 2017 (blue numbers are observed) but the fitted mean value (black numbers) is much higher at 289M. Further, the method is projecting the company will pay 284M GBP in the next calendar year!
The method clearly provides false indications.
The optimal model identified in the Extended Link Ratio Family (ELRF) modeling framework applied to the last five calendar years has trends, intercepts, and very few ratios (because they have no predictive power). The residuals are much improved (left). The trends in the data are more in line with the trends in the method.
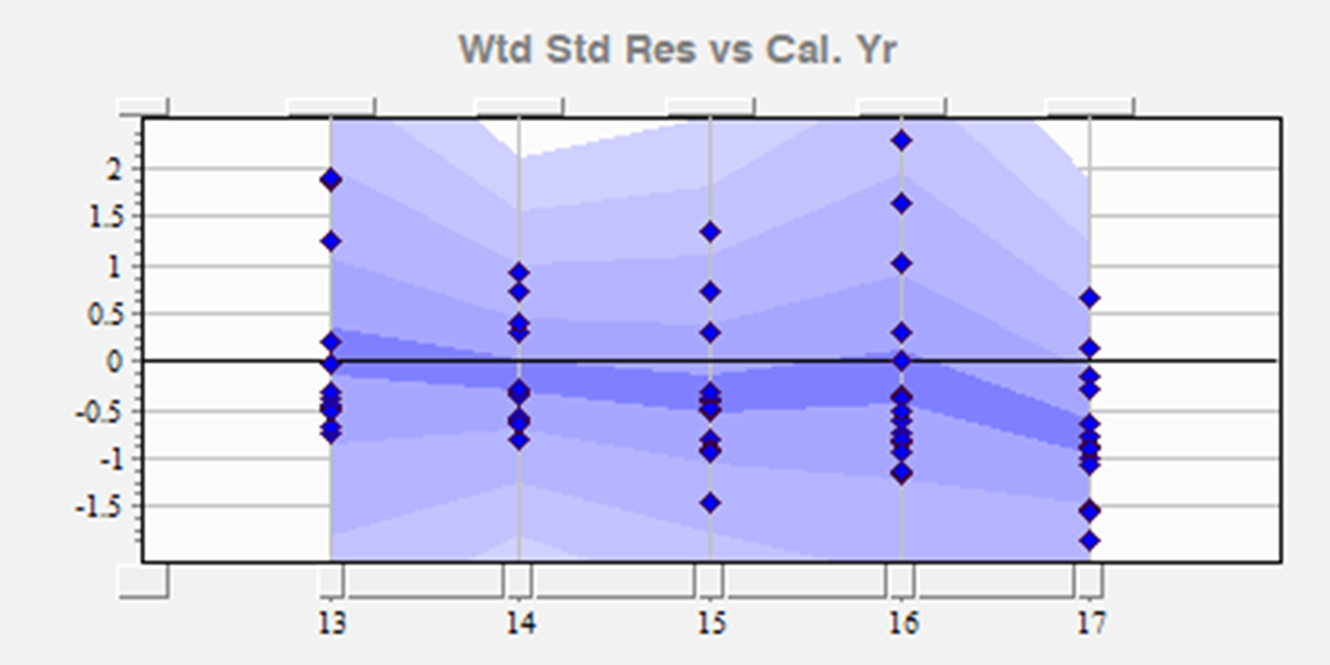
The total reserve mean projected from this identified model is 504M – around half the original Mack method projected mean reserve! This is a much better estimate of the reserve mean, but how do we know it’s the best?
Let’s see what is really going on
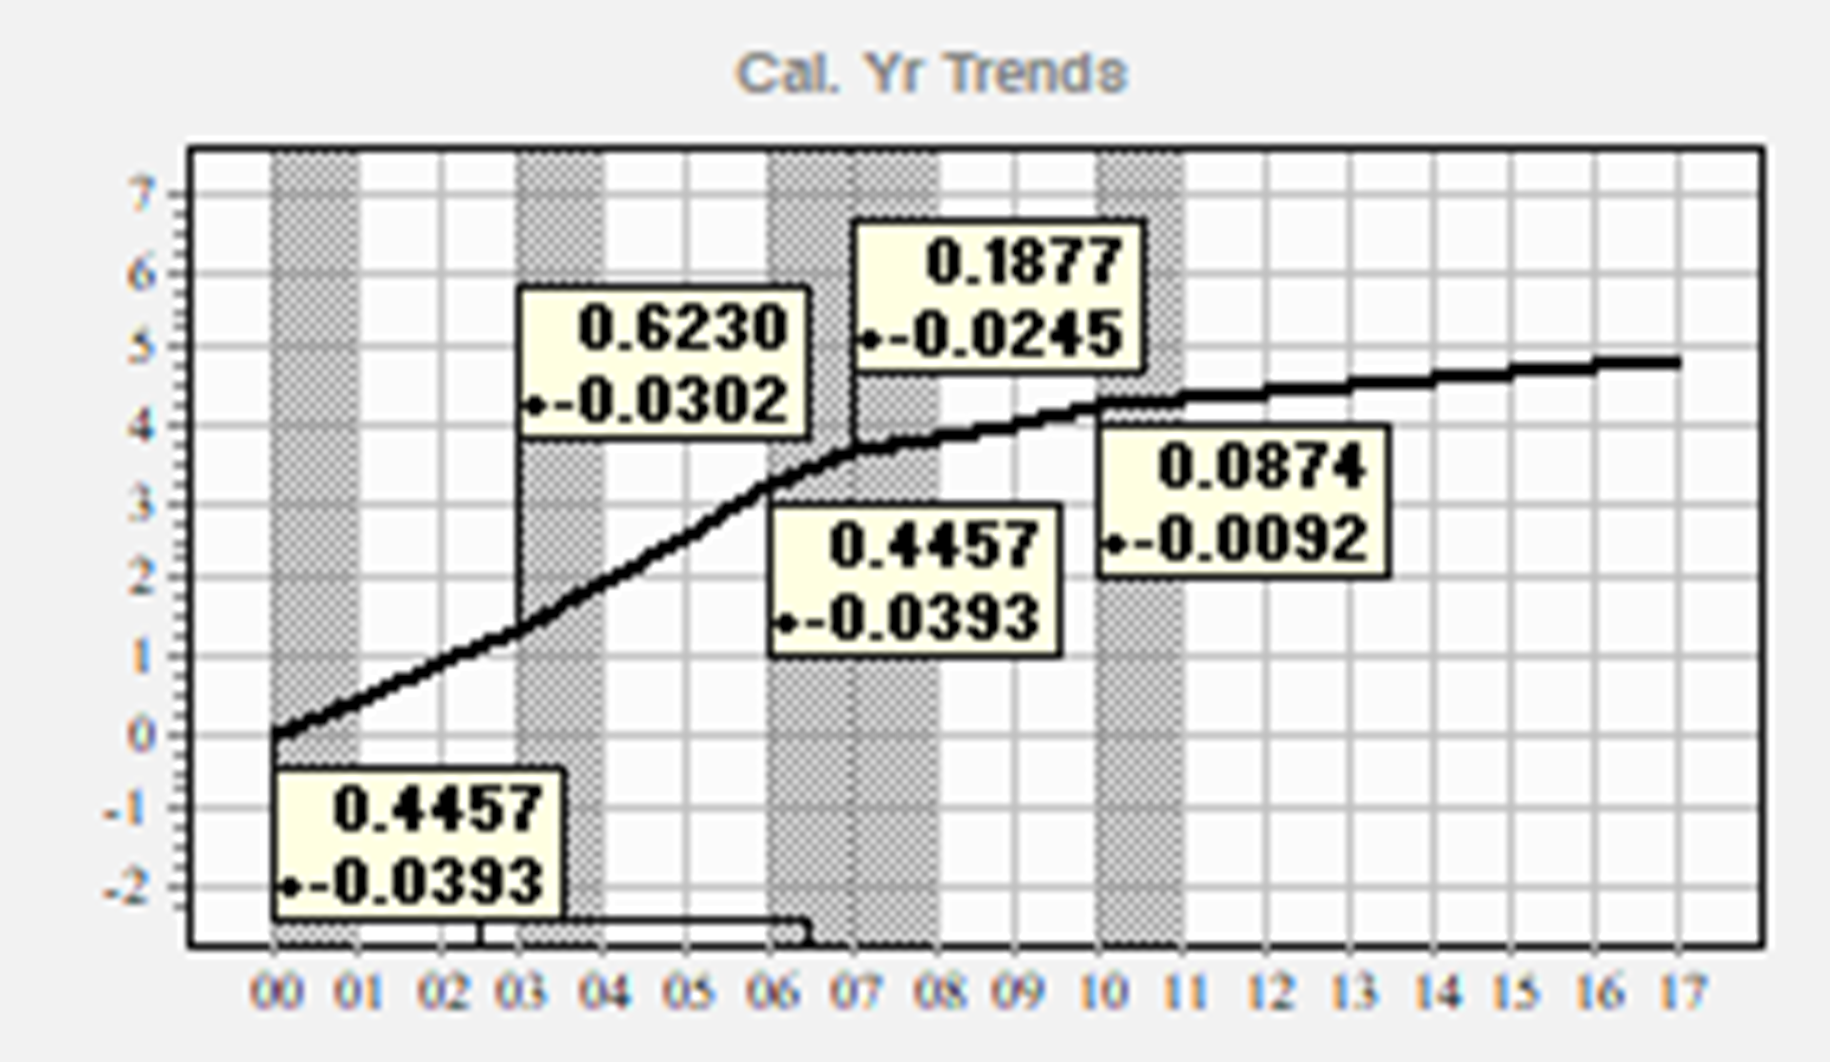
The identified model in the PTF modeling framework has calendar year trends as seen on the right. The calendar year trends are much lower more recently. Trends in other loss types (for instance: Case Reserve Estimates or Number of Claims Closed) can be related to the trends in the paid losses.
The actuary now has a narrative about the data.
Projections from the PTF model are much more realistic. The forecast scenario in PTF, using the 8.7%+_ calendar year trend, projects a mean payment of 223M GBP next year – much more in line with the recent history. The total mean reserve is 598M.
The actuary has control over all future trend assumptions in the PTF modeling framework. These can be related directly to the trends (or volatility) observed in the past – including CREs or NCC.
To get in the ballpark of the original forecasts of the Mack method, the future calendar year trend has to increase from the most recent 8.7%+_ calendar year trend to more than 25%+_ for the entire run-off period!
Link Ratio Methods residuals around zero: projections too low
Maybe you think using Incurred Losses gives better estimates than Paid Losses?
Consider the Incurred Loss data from Best’s Schedule P (2011) for Tower Group.
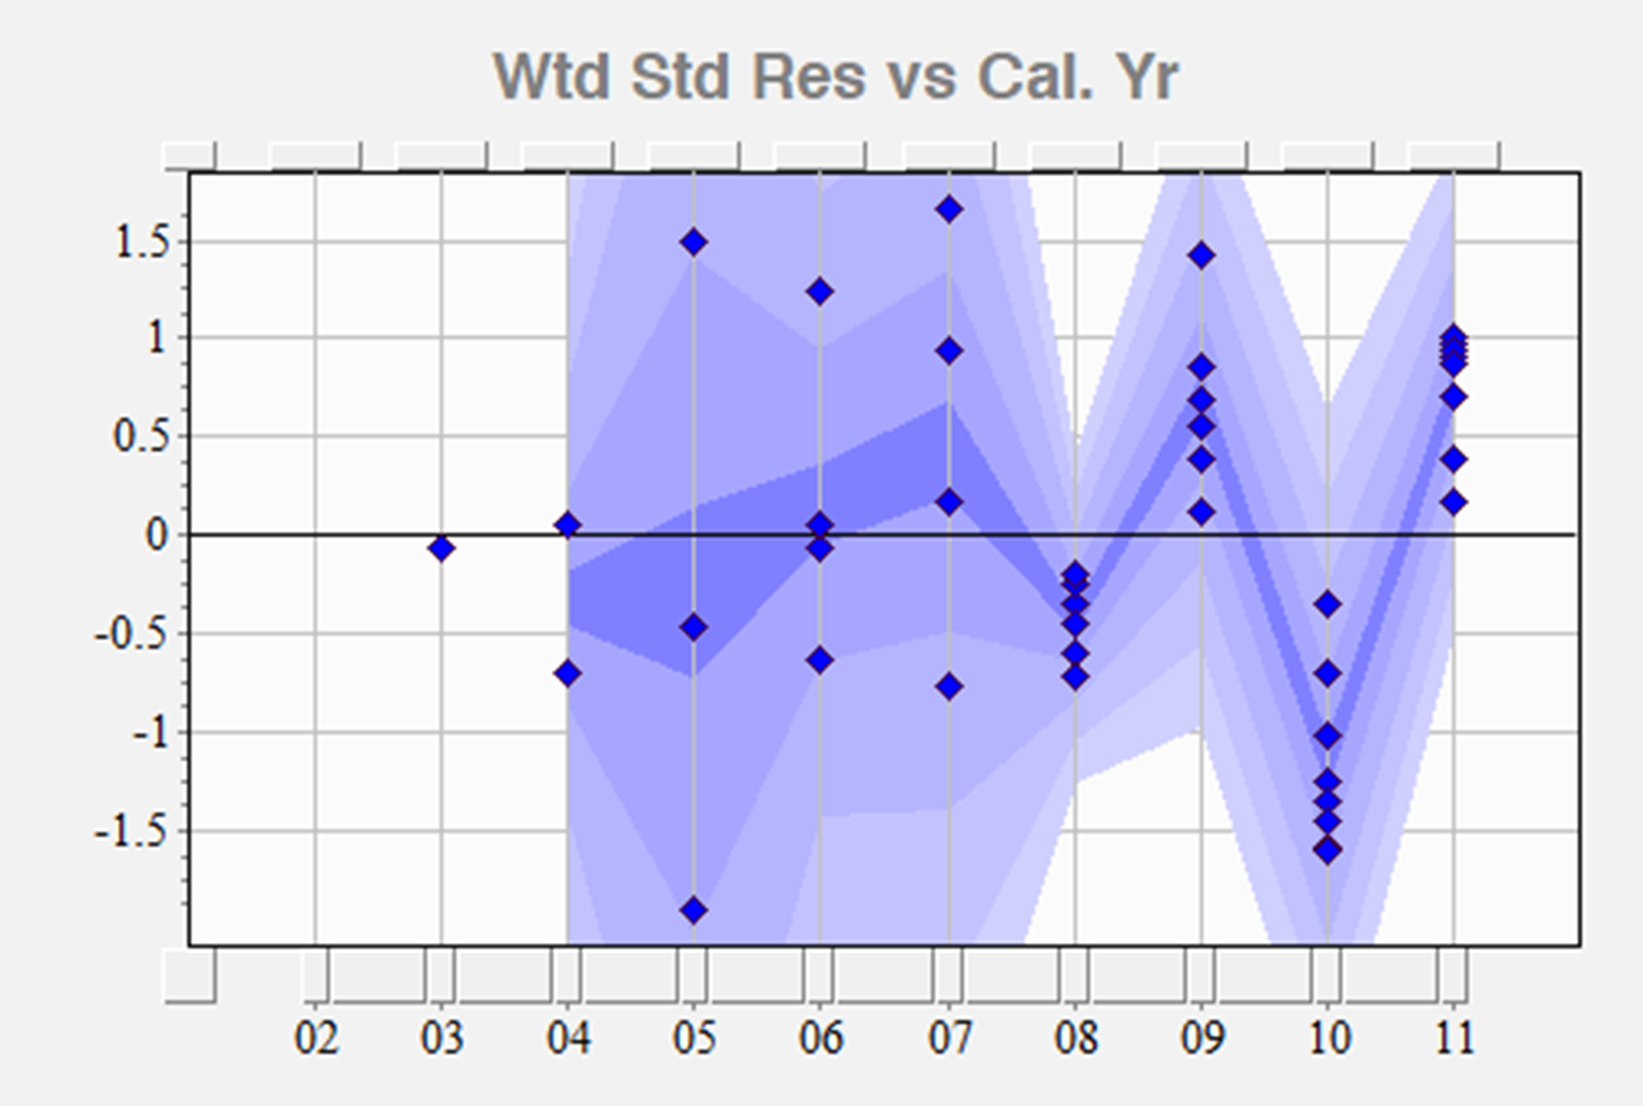
On the right are residuals from the Mack method applied to the Incurred Losses. The zig-zag conflates what is going on.
The total mean reserve projected by the Mack method is: 1.059B. The held reserves by the company as of 2011 were 921.9M. By calculating chain ladder ratios excluding the ‘high’ calendar years of 2009 and 2011, the forecasted total reserve drops to 950M.
The held reserves were supported by link ratio methods.
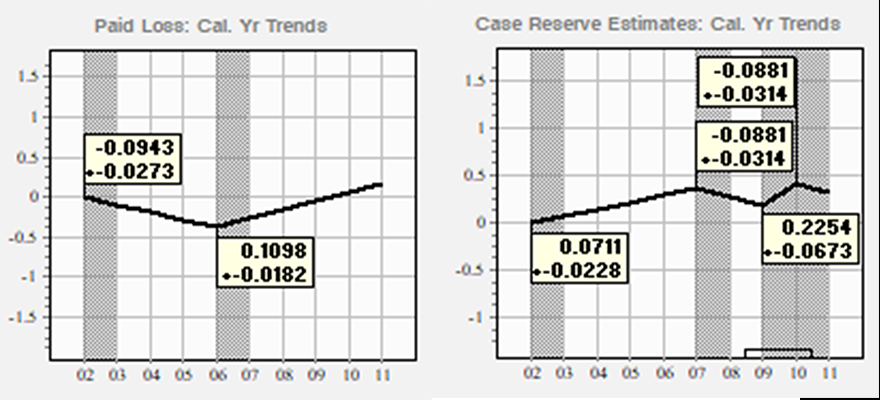
In the PTF modeling framework, Paid Losses and Case Reserves are modeled separately. Note the calendar year trends are not the same in the Paid Losses (left) and Case Reserves (right).
In order to reach the reserves held, the calendar year trend for the future has to change from +11%+_ to -16.85%+_ - a total difference in trend of nearly 28%!! This is impossible!
Without access to the PTF modeling framework, how would you know whether your projections are meaningful?
- Since 2006 the paid losses have been increasing 11%+_ faster than Earned Premium. This leads to an 11% increase in loss ratios (not reflected in the company’s held ultimates).
- Since 2007 the Case Reserve Estimates have been fluctuating (thus the masking of trends in the Incurred Losses).
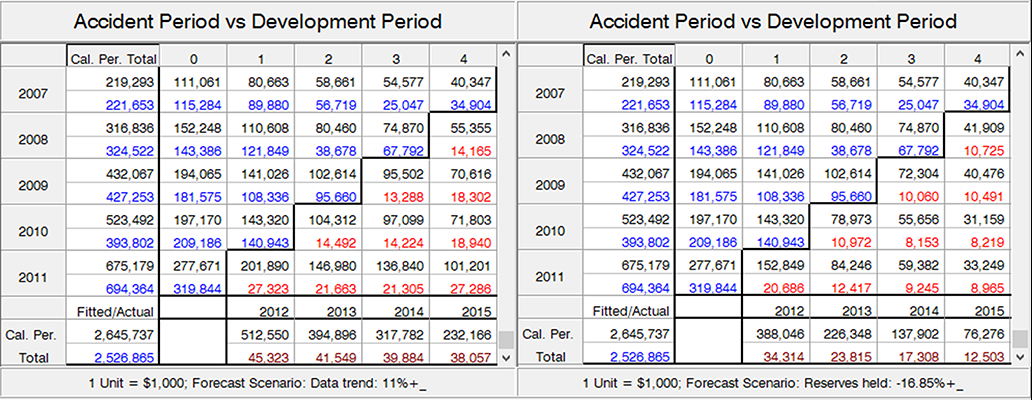
The forecast table on the left assumes the 11%+_ trend continues. The projections are increasing down the accident periods (eg: dev 4) just like the observed paid losses (blue numbers) in dev 0.
On the right is the forecast where the assumed future trend is set to -16.85%. Projected payments are decreasing down the accident periods (dev 4) despite the significant increases in observed paid losses and Earned Premium
(Tower Group went into administration in the fourth quarter 2013).
Link Ratio Methods residuals trend up: projections too low
Consider anonymized Paid Loss data for a large Worker’s Comp provider.
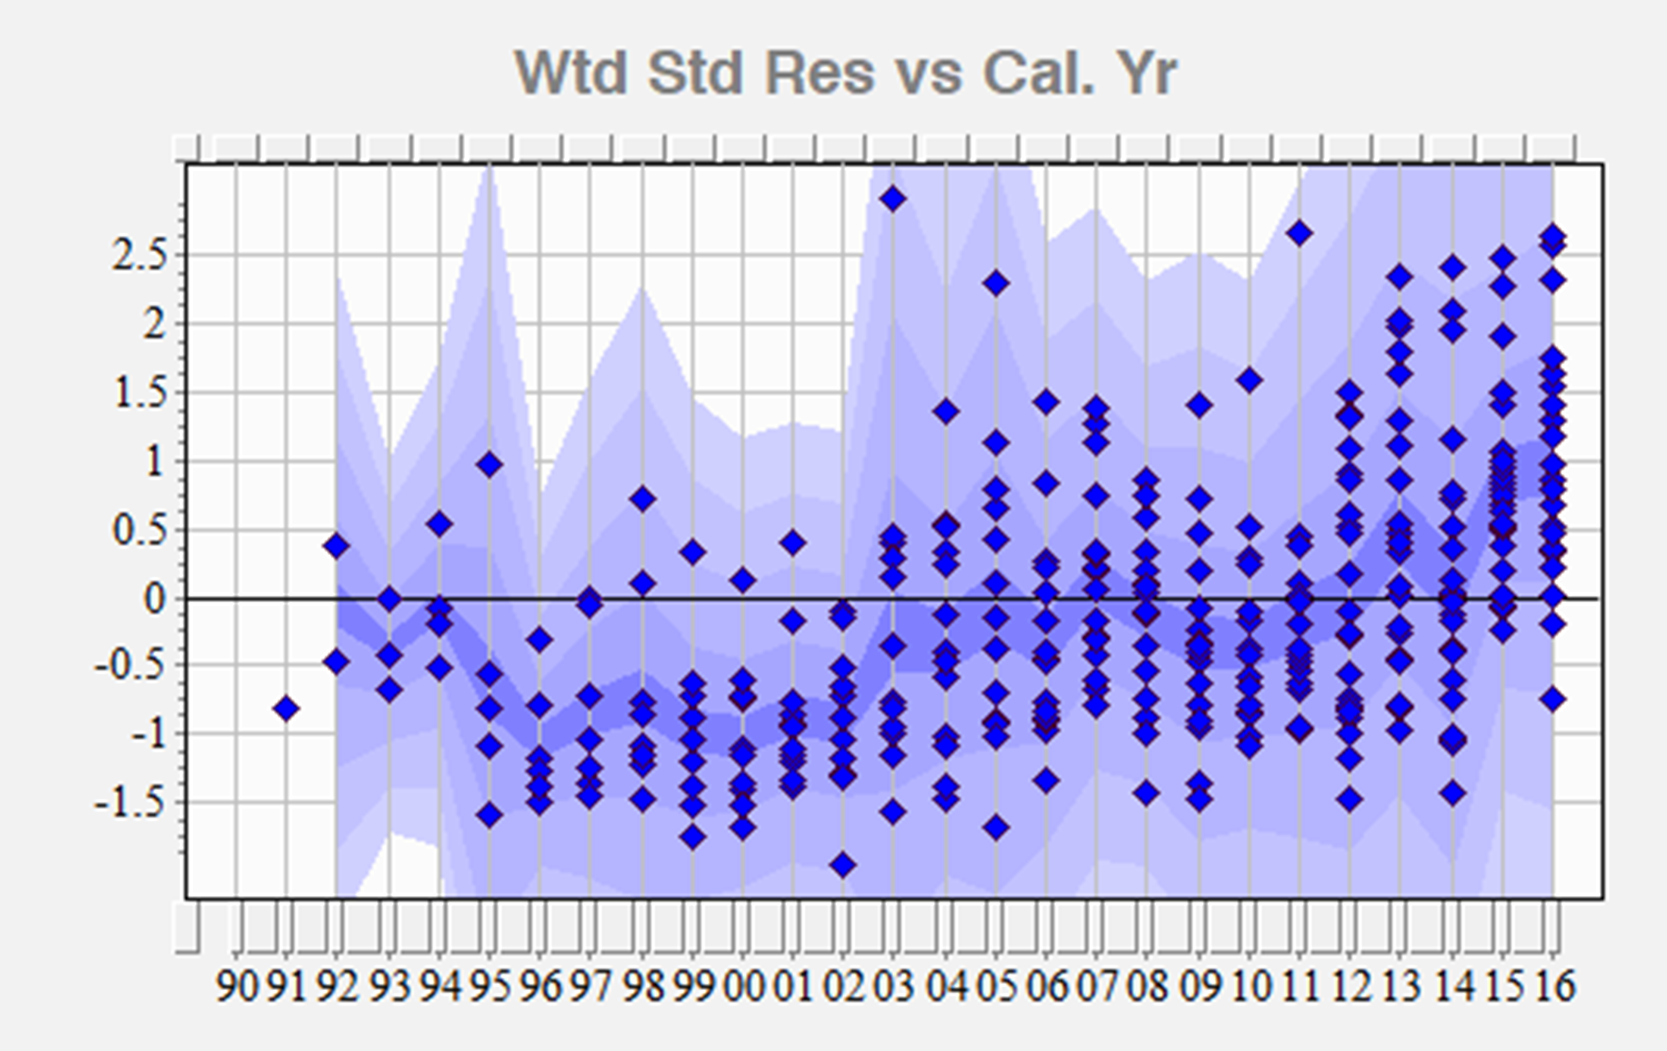
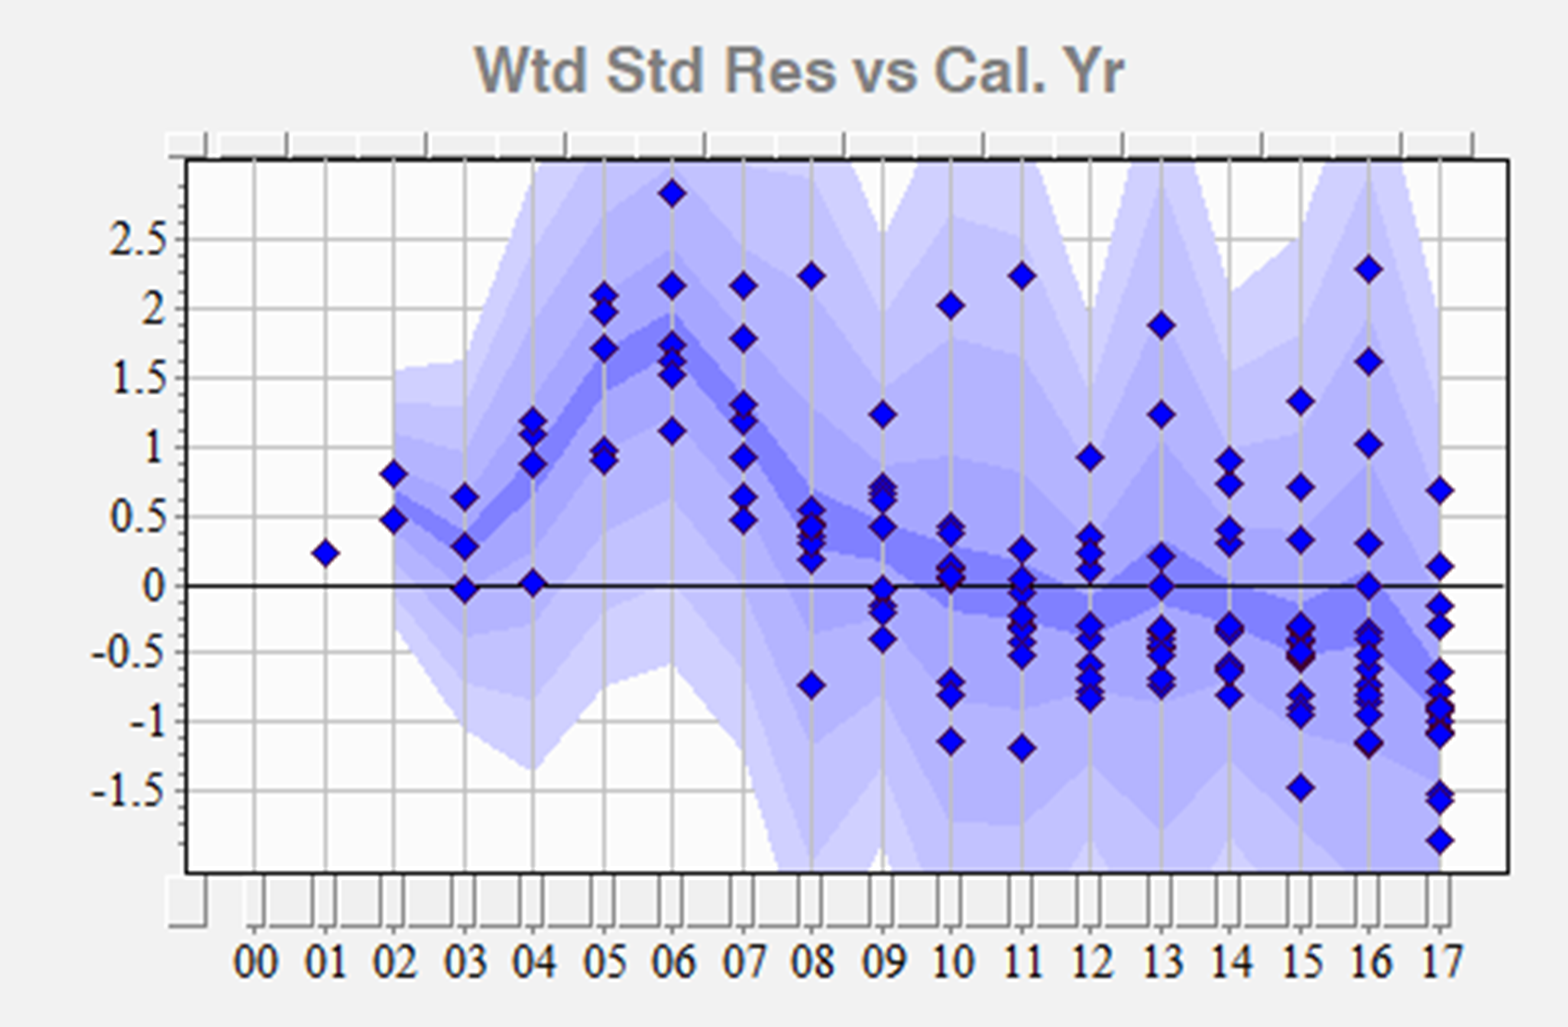
The display on the right shows a strong upward trend in the residuals (trend in data minus trend in method) versus calendar year.
Any link ratio method will grossly understate the reserves – the trend in the method is less than the trend in the data. Using the Mack method (volume weighted average), the total reserve is 839M.
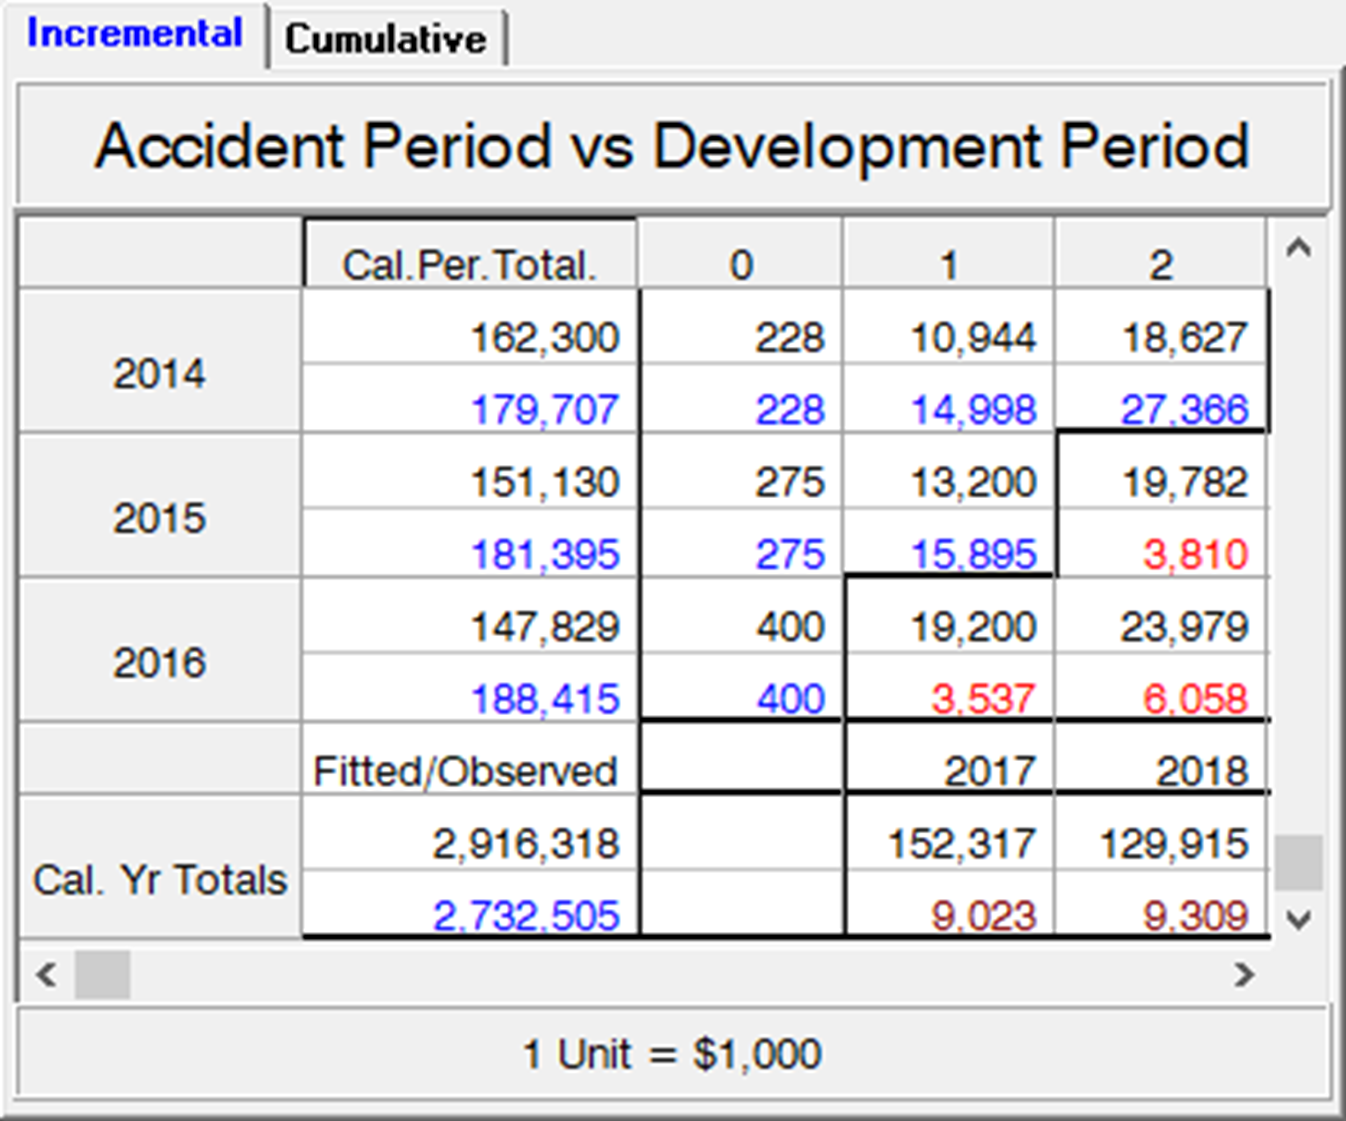
The company just paid 188M USD in 2016 (blue numbers are observed) and the method is projecting the company will pay 152M USD in the next calendar year (black numbers are fitted means).
The method clearly provides false indications.
If every successive year you take weighted average link ratios of the last four years,each year the estimates of the prior year ultimates will increase, and projections of the paid losses for the next year will be too low.
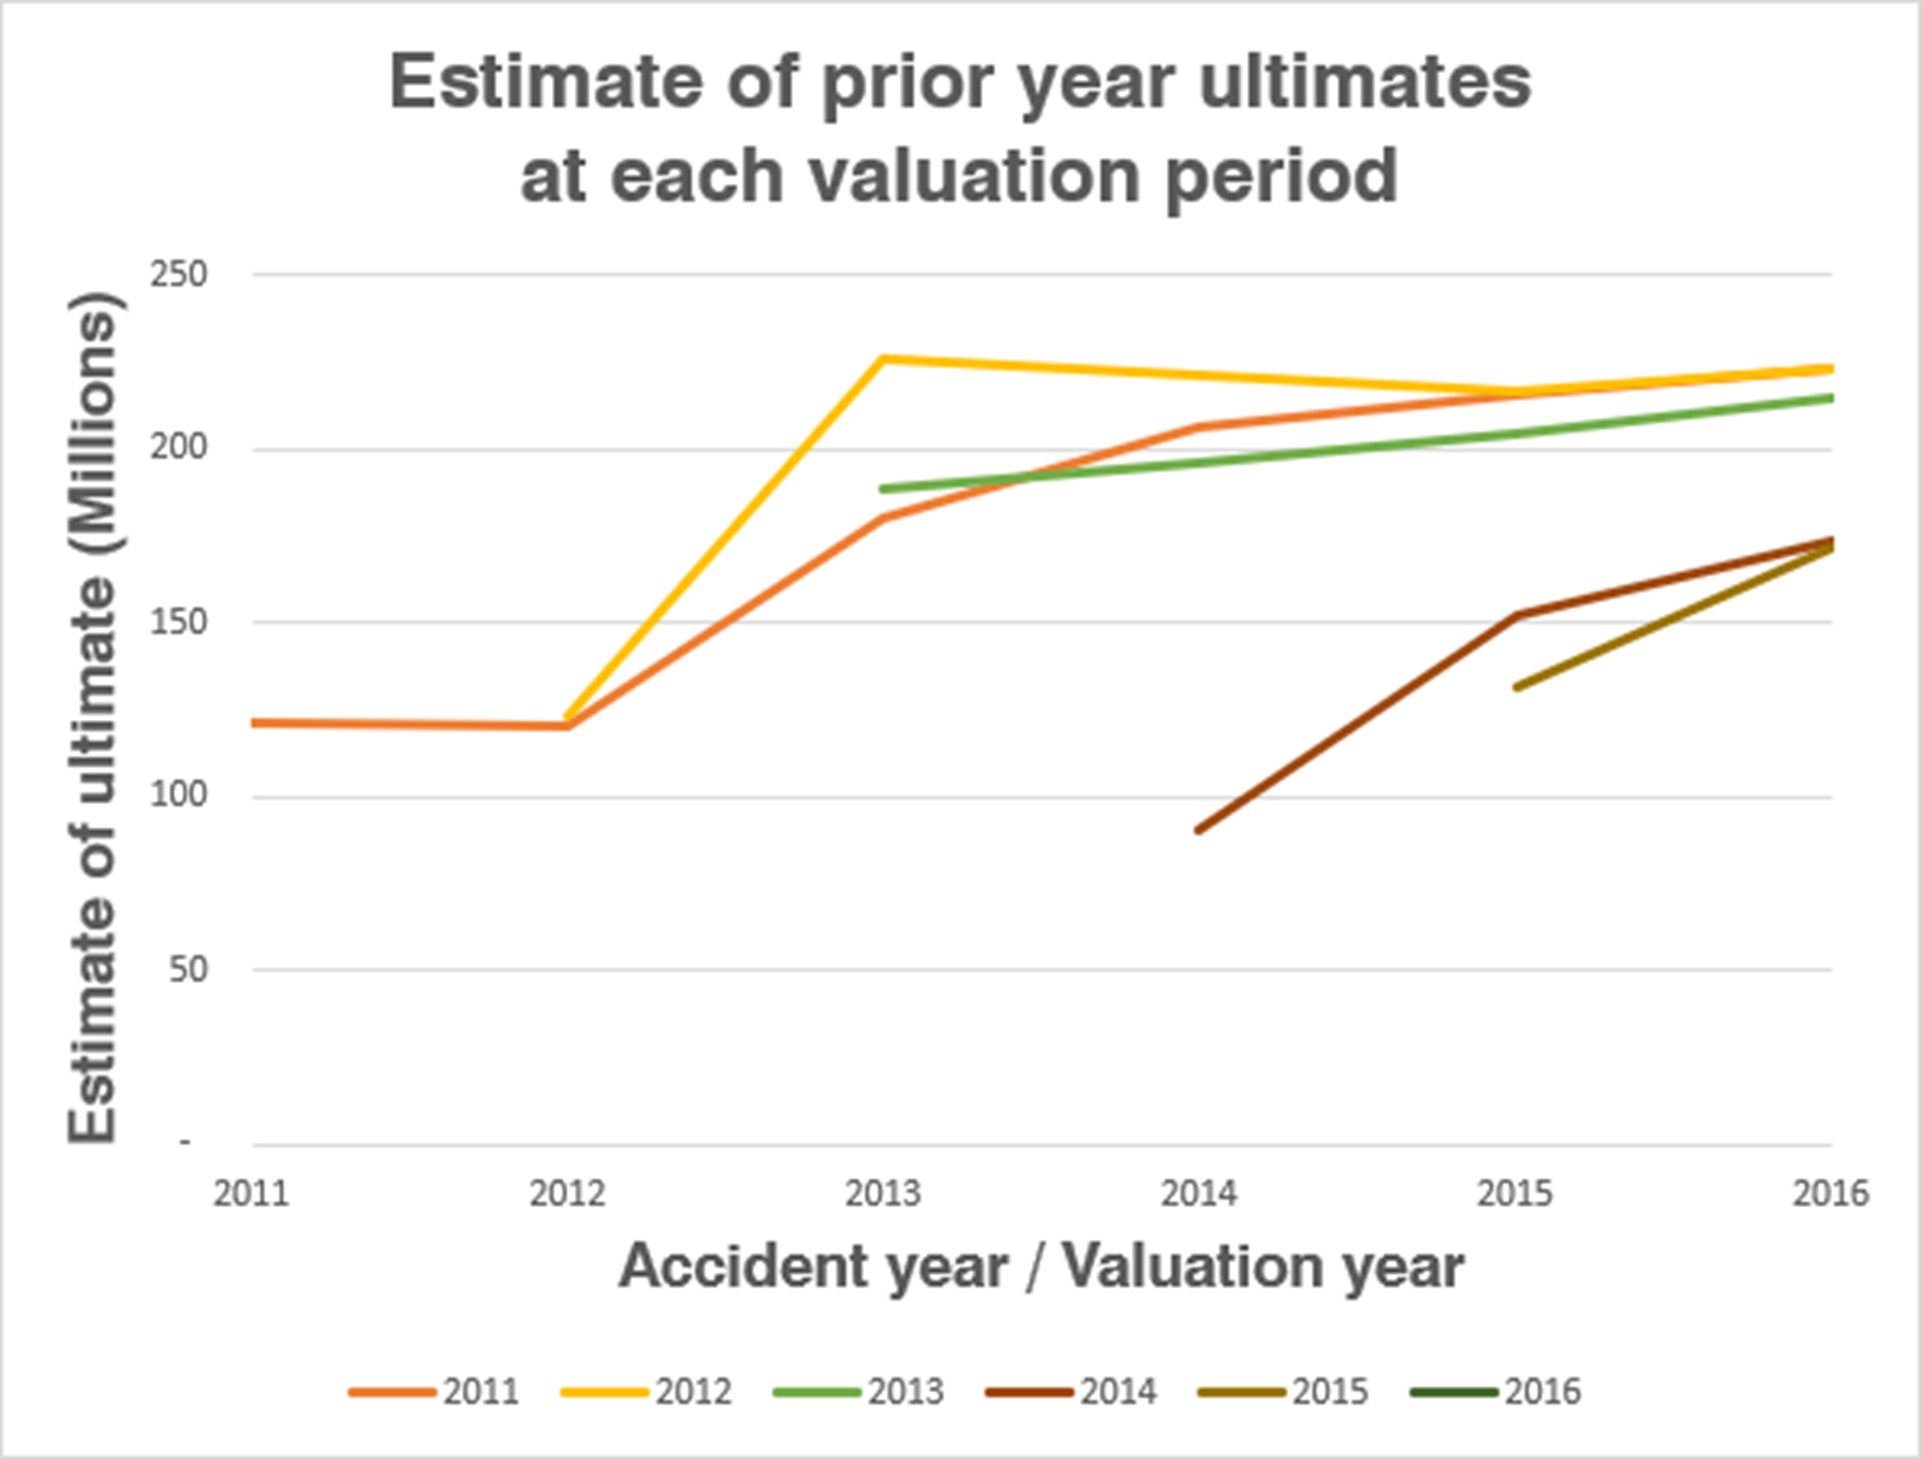
To illustrate this, estimate the four year weighted average each valuation period from 2011 through to 2016 and plot the prior year ultimates.
Assuming the same link ratio method is applied in each of the four years, the company is in catch up mode.
For this particular portfolio, the social inflation is very high.
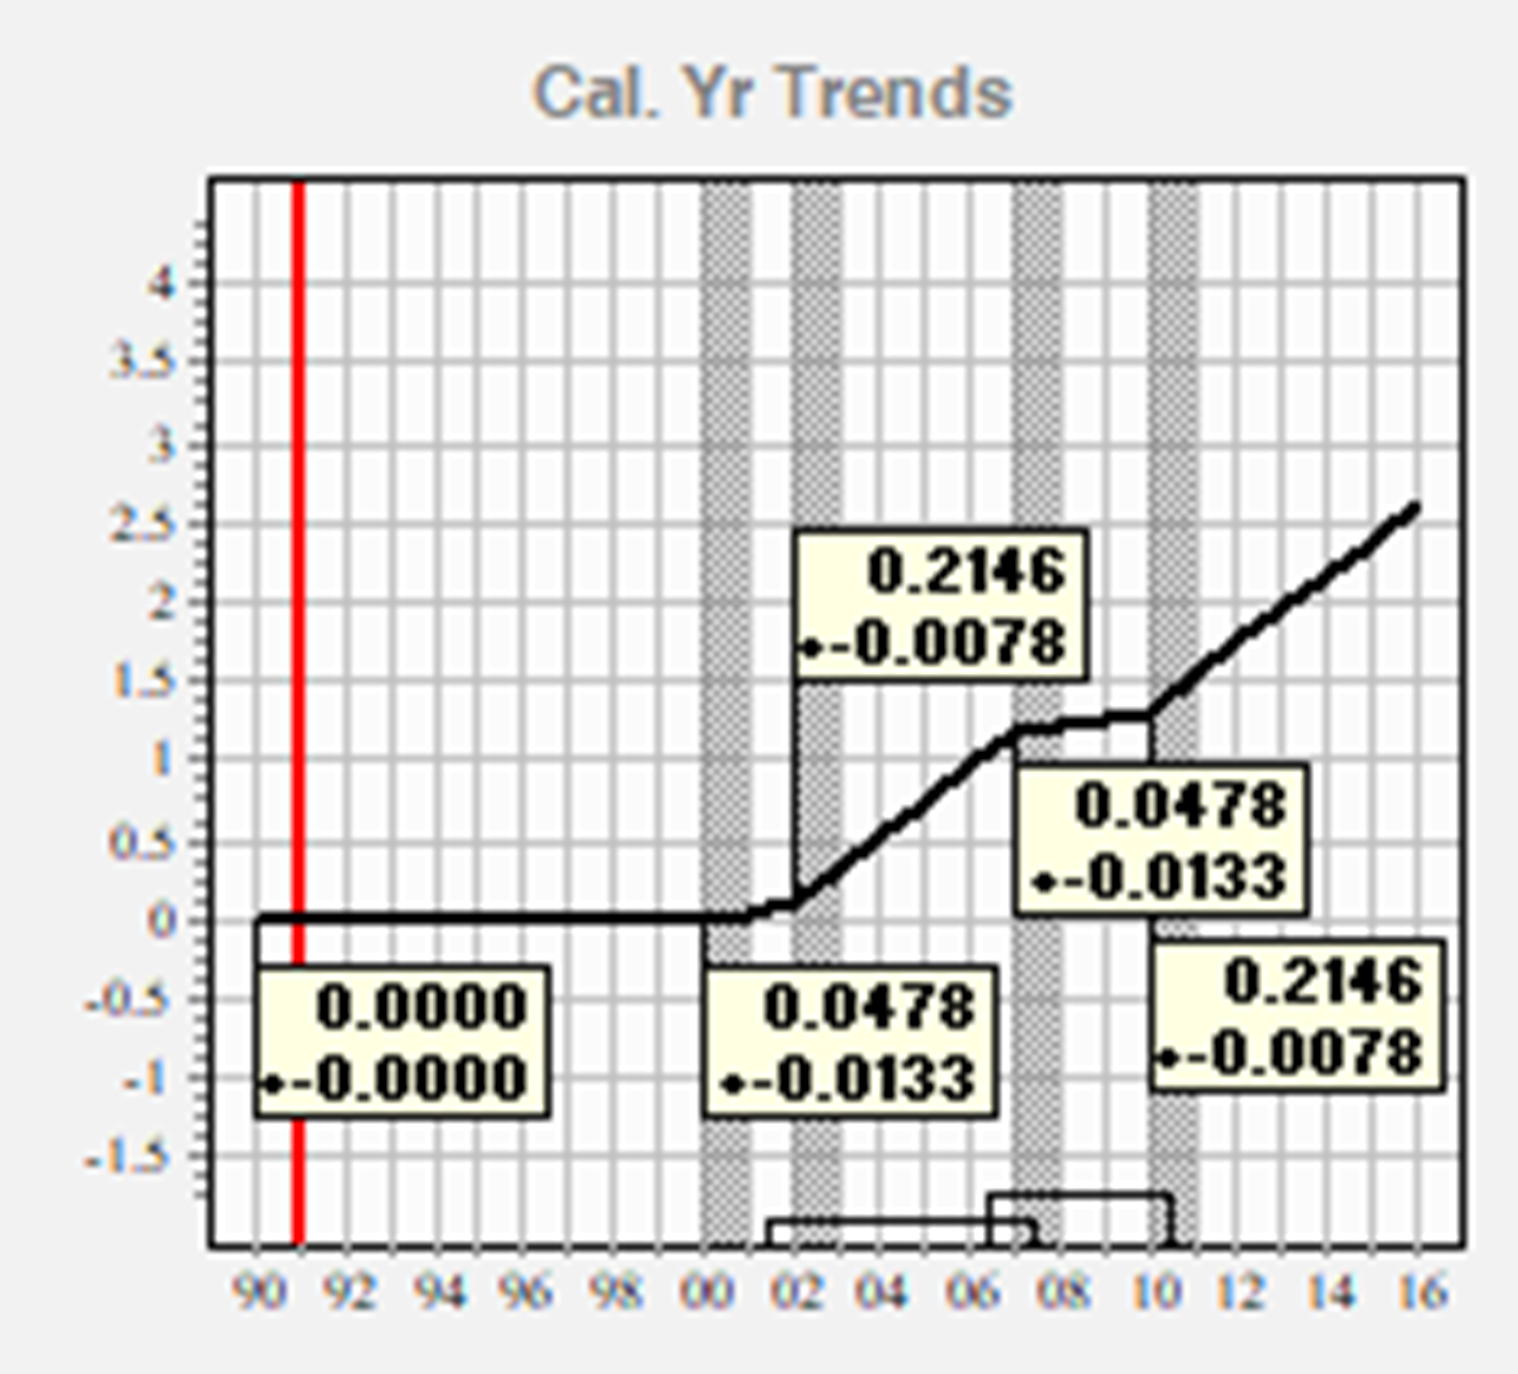
The optimal PTF model, whose calendar year trends are displayed on the right, projects a total mean reserve of 1.309B if the trend of 21.46%+_ continues for several years.
Link ratio type methods cannot measure social inflation.
The PTF modeling framework enables you to mitigate model specification risk and extract maximum information from the data.

We cannot solve our problems with the same thinking we used when we created them.
- Albert Einstein