Statistical analysis of Tower Group A.M. Best Schedule P (2011) data clearly indicates a woeful level of under-reserving
Statistical analysis of Tower Group's year end 2011 A.M. Best Schedule P data reveals alarming reserve health indicators and woeful reserve inadequacy.
In short:
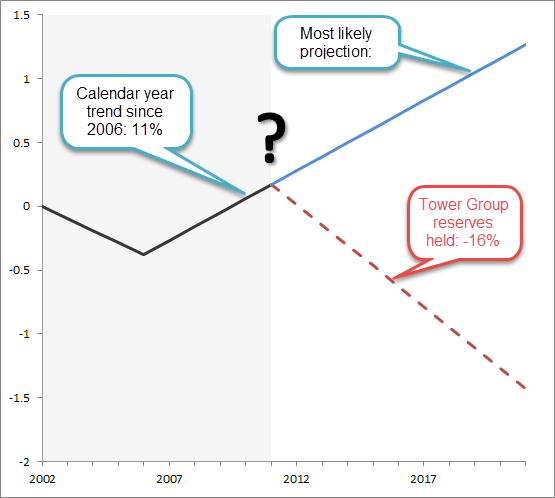
- Inflation (social and economic) of paid losses exceeded earned premium growth by 11% per year for the last five years (2006~2011);
- To reach Tower Group's reserves held and loss ratios - the assumed future calendar year trend must be -16% per year for all future calendar years; and
- There would have been no adverse paid loss experience, had the company identified the model that reflected the salient risk characteristics of the business.
According to Insureware's analyses, further significant reserve strengthening (or upgrades) are very likely.