We discuss the consistency of estimates of prior accident year ultimates on updating (next valuation period), consistency of Solvency II metrics, and loss reserve increases on updating.
Reserve increases from year to year
Consider a company that writes the same mix of risks each year with the same exposure level each accident year. Suppose calendar year inflation in the paid losses is stable and is 5% every year.
For reserves to be computed accurately the company should be assuming 5% inflation going forward at each valuation period.
In this scenario, the following applies:
- Each year the company needs to increase its total reserve by at least 5%.
- Each year the company needs to increase its premium (price) by at least 5%.
- The ultimates for prior accident years will remain consistent with each increase in total reserves.
- Ultimates increase by at least 5% from one accident year to the next.
The principal reason for these facts is that calendar year inflation projects both onto the accident years and development years - it also impacts all prior accident years.
The increases in total reserves each year should not be regarded as an upgrade. If the costs in running the business increase by 5% each year then the company should at least increase the price of the product by 5% to stay even. If the total reserves are not increased by at least 5% each year the company will be under reserved!
Estimates of prior ultimates remain consistent on updating from year to year only if the forecast assumptions remain consistent. For further information see this article.
Consistent estimates of prior year ultimates on updating
Consistency of prior (accident) year ultimates on updating is related to the discussion in the previous section on loss reserve increases on updating. Ultimates remain consistent from year to year if forecasting assumptions remain consistent. For example, if a forecast scenario assumes a calendar trend of 10% +- 2% for next year followed by 5% +- 1% thereafter, then, for an accident year ultimate to be consistent from this year to next year requires that the next year's data fall within the 10% +- 2% trend line and that the subsequent calendar trend at this year end continue to be set to 5% +- 1%.
It is only in the PTF modeling framework and the MPTF modeling framework that calendar year trend assumptions are explicit, auditable, transparent and can be monitored on updating.
Consistency of Solvency II Risk measures
Most importantly Solvency II capital risk measures and MVM calculations remain consistent on updating only in the PTF and MPTF modeling frameworks.
For example, a PTF model was applied to a WCom dataset in 1986 and updated in 1987. The updated projections remained consistent as:
- The data arriving in 1987 followed the projections made in 1986
- The estimates of the model parameters incorporating the 1987 data are statistically the same as the 1986 estimates
- The assumptions beyond 1987 are the same in 1987 as for 1986.
The calendar year parameters were:
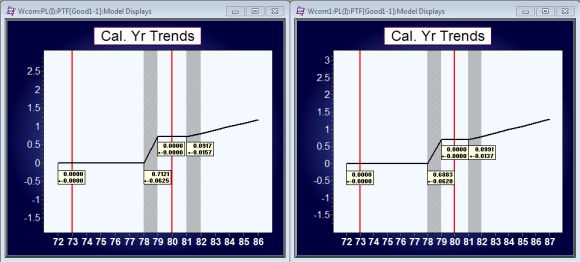
Note that calendar year trend 9.197%+_1.57% is updated at year end 1987 to 9.91%+-1.37%. The change is statistically not significant.
The forecast summary (by accident period) is consistent (the mean increases by around 10% which is consistent with the calendar year trend).
If either the model, or future year assumptions, changes between valuation periods, then the projections are not expected to be consistent.
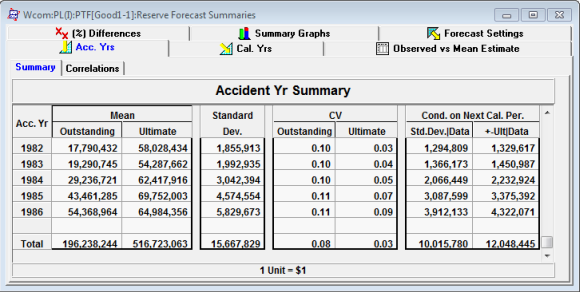
Forecast Summary for 1987 valuation year
Forecast Summary for 1988 valuation year
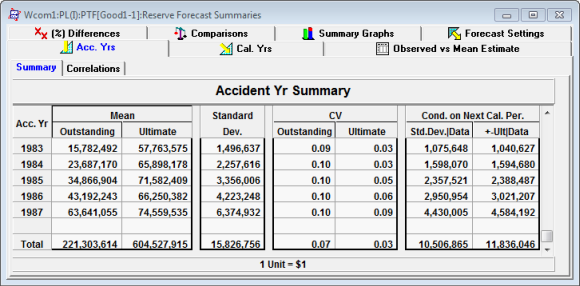
Note the estimates of the ultimates between 1986 and 1987. In 1986, the mean ultimate for accident year 1986 is 64.98M. In 1987, the estimate of the same (1986) accident year's ultimate is 66.2M. These estimates are statistically consistent as the estimates are mean ultimates. The expected variation in 1986 of the mean ultimate (1986) is 4.3M. The new estimate of the ultimate in 1987 is well within one standard deviation. Similarly, the 1985 estimates of 69.8M and 71.6M for 1986 and 1987 year end are statistically consistent.
The two columns on the right of the accident year summary tables show the expected change conditional on the next year's data. The first column, Std Dev | Data, shows the expected new standard deviations for next years' model conditional that the next year's data follows the projected model assumptions. Similarly, the second column shows the expected change in Ultimate given the next years' data follows the projected model assumptions. This allows us to check for consistency between ultimates when the next years' data are included in the model.
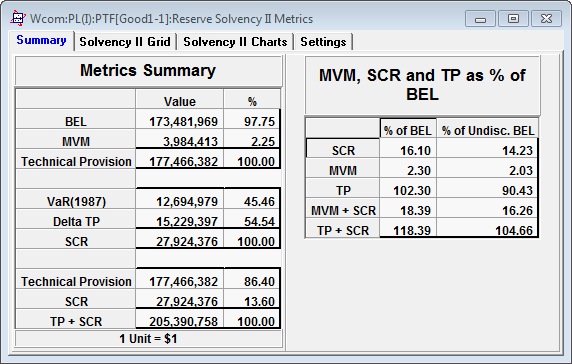
The calculation of risk capital is also consistent between years; the SCR requirement is essentially the same for both valuation periods. Note a discount rate of 4% and a spread of 6% are applied.
Solvency II metrics for 1986 valuation year
Solvency II metrics for 1987 valuation year
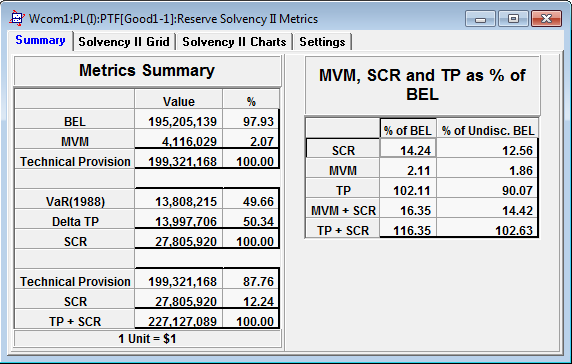
The SCR estimates of 27.9M and 27.8M are almost identical for 1986 and 1987 respectively. The estimates of BEL and MVM increase from 1986 to 1987 but this is due to the 9.2%+_ increase in calendar trend.
As mentioned above, consistency depends on whether the predicted forecast assumptions for the next year and following a) occur for the next year and b) that the same forecasting assumptions used previously for the following years are applied in the subsequent forecast. Any change in assumptions will make prior year ultimates on updating inconsistent.
See here for demonstration videos illustrating Solvency II metrics and consistency on updating.