Step 1: detrending the series
Before assessing the correlation between any Lines of Business, we first need to detrend the series. See the discussion on Correlations and Linearity where this is examined in more detail.
Neglecting this first step of detrending, results in spurious correlation measures equivalent to studies where two (or more) series are moving in the same way but are actually not related. Thus the famous 'correlation is not causation' statement.
Let's example these ideas in the context of two case studies. The first case study is a set of layered data. In layered data, we expect high correlation by definition since layers are subsets and expected to be directly related. The second example will be two distinct Lines of Business.
Case study: 1M, 2M, 1Mxs1M
The models for the three layers are shown below:
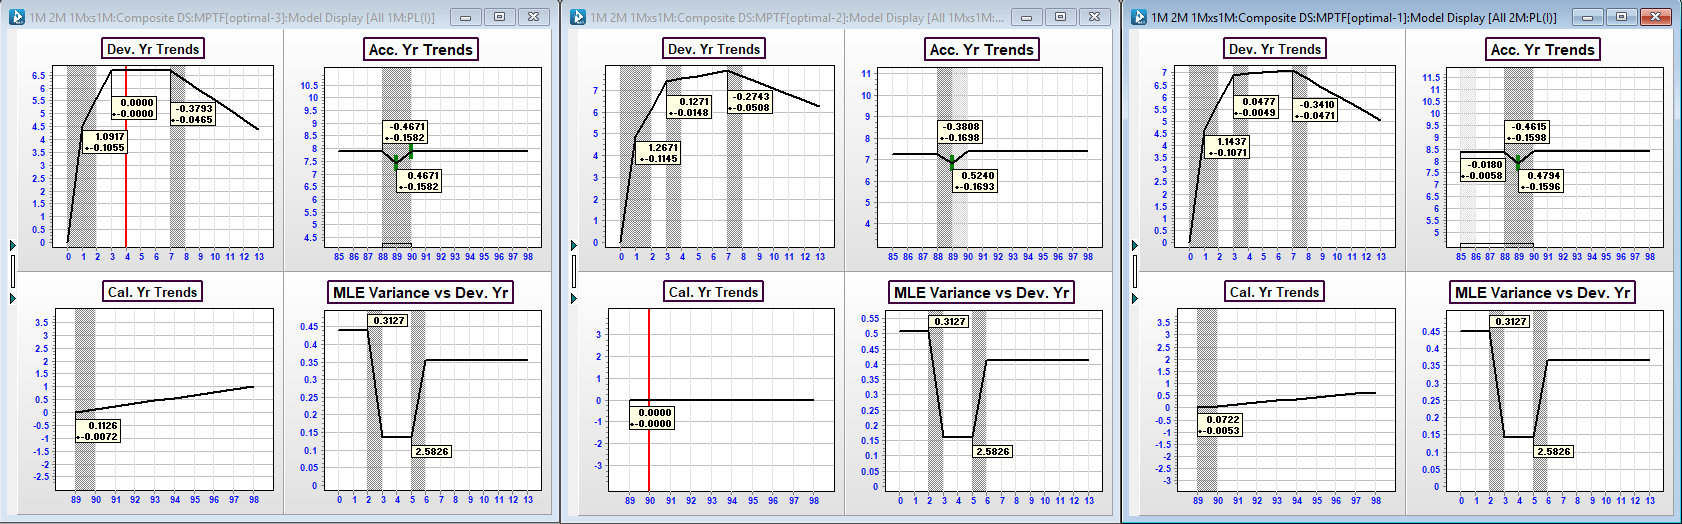
Structurally, the models are near identical. This makes sense and is exactly what we would expect given the close connection of the data definition. Further, if you estimate the correlation between any layer set (eg: 1M and 2M shown below), the correlation after detrending is very high (almost 1 in this case). Again, this is intuitive as residuals that are higher than expected in the lower layer going to be higher than expected at the higher layer and vice versa.
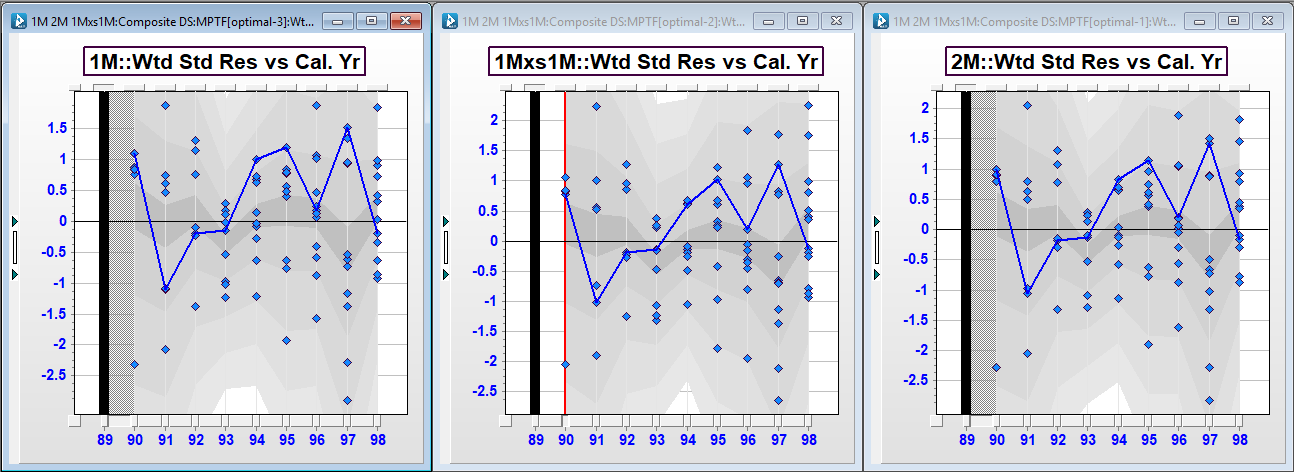
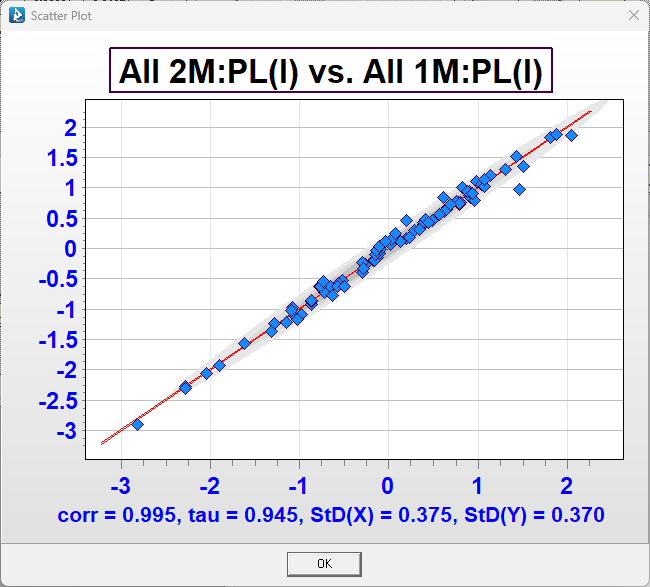
The residuals above are shown by calendar year for each model; with a trace through the first accident year. The residuals look near identical and the trace line similarly shows the residuals moving in the same way in each model. The correlation is very high. An example of the scatter plot between the 2M layer and the 1M layer ils shown below.
Case study: LoB X, LoB Y
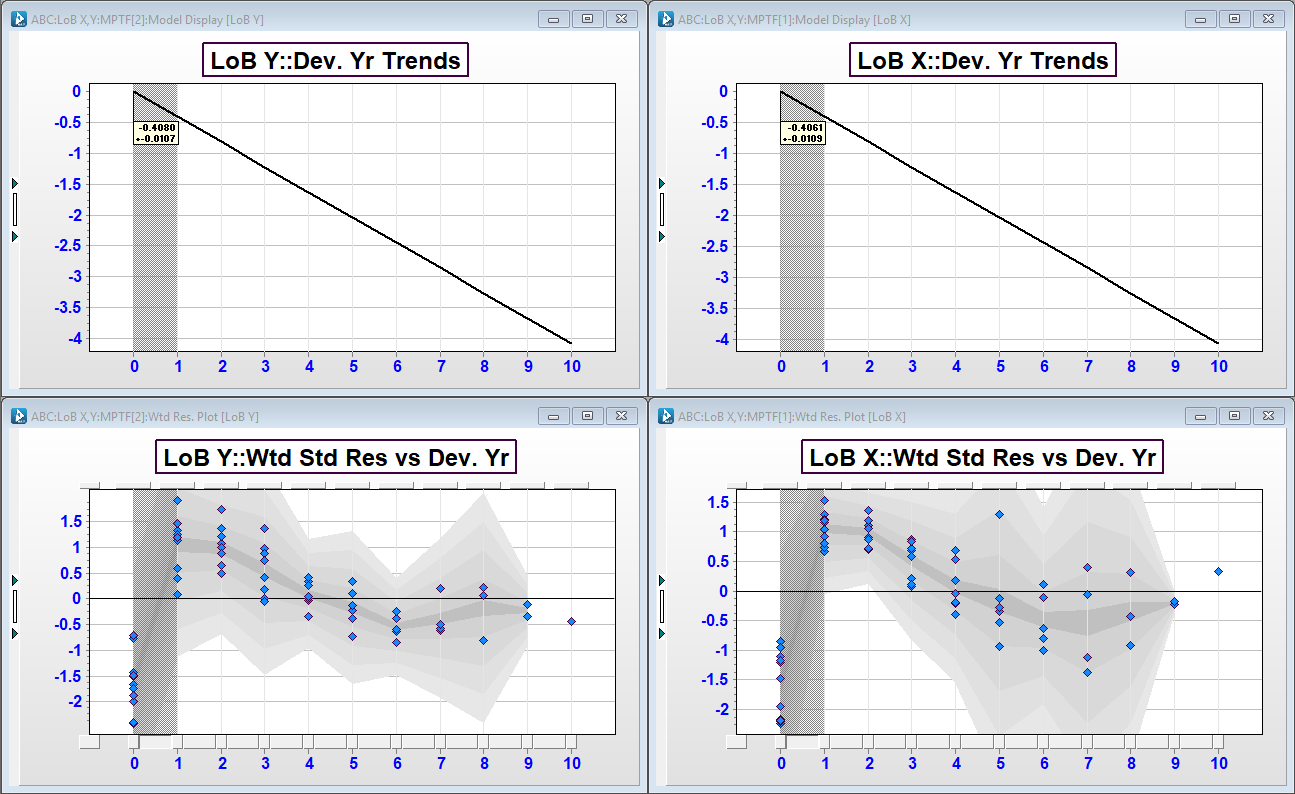
Let's consider two auto lines of business, X and Y. Focusing just on the development trends, we can see that the development trends are extremely simimlar in location of trend changes and the magnitude of the trends.
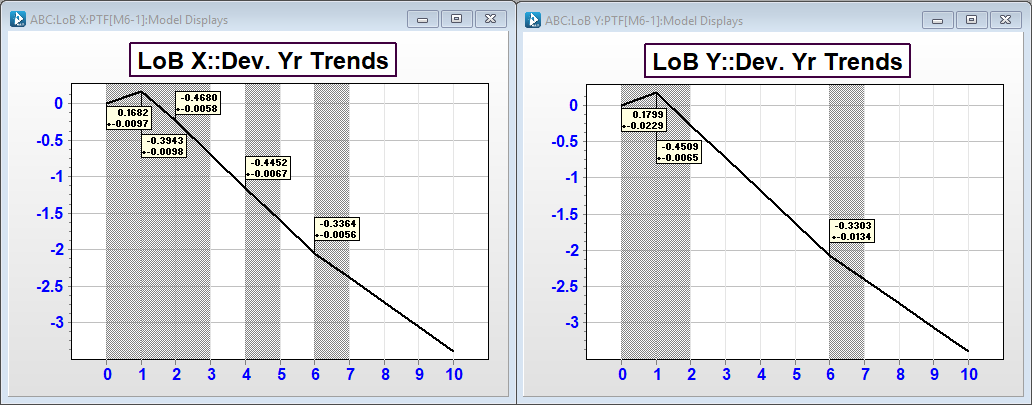
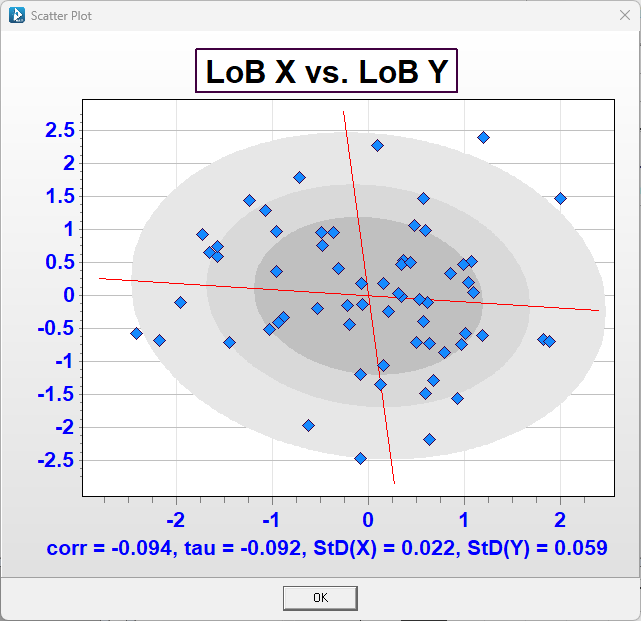
If we calculate the correlations after detrending the series, we can see the correlation between LOB X and LoB Y is statistically zero.
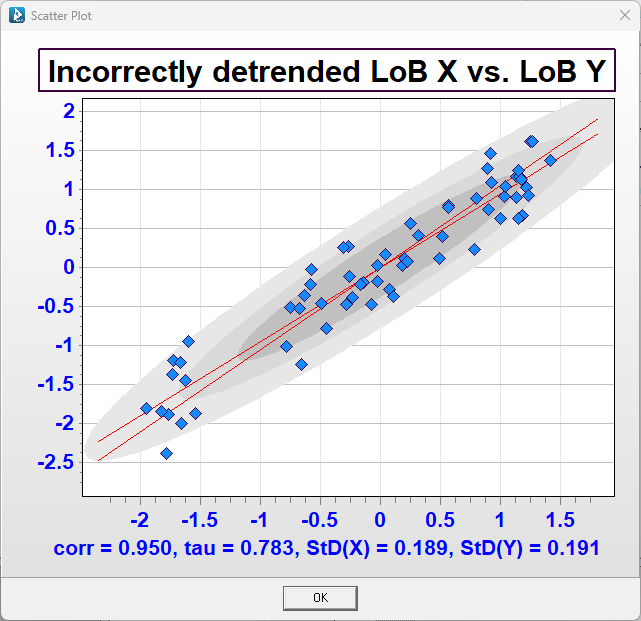
Let's say instead that we only fit a single development trend (and similarly a single trend in the other two directions respectively).
In this case, we have not properly detrended the series and the scatterplot is instead with a spurious correlation measure of 0.814!
In order for risk capital diversification to be assessed and reflect the true risk of a portfolio, the loss development arrays must be detrended correctly (all parameters accounted for) with correlations derived from the data. See also: Risk Capital Management in ICRFS. Aside from the ramifications on the mean if a loss development array is not parameterised correctly, an incorrect parameterisation leads to a flawed estimation of risk capital also. Models for risk capital must fully detrend the underlying loss development arrays or the analysis for risk capital will be defective.