There is a common misconception in the Insurance industry that economic inflation is the driving component of calendar year trends. Thus, much attention is applied to the selection of future inflation rates and the analysis of alternative future inflation scenarios.
Intuitively, this is a reasonable approach. However, it is the trends in the data which must determine the final trend scenarios and analysis. If data contains trends which are contrary to our expectations, then we must revise our original hypothesis of the impact of economic inflation and make amendments to our future scenarios accordingly. It is inappropriate and unscientific to twist the data to fit our preferred theory.
If economic inflation is the primary driver of calendar year trends, then we would expect high calendar year correlation between multiple LOBs written in the same economic region since economic inflation would drive portfolios in a similar fashion. Further, it would not be unreasonable to extend this to an expectation that companies and the industry are driven by similar calendar year structure since all are subject to the same economic inflation.
Conversely, if we find vastly different calendar trends for each portfolio, then we can conclude that economic inflation is not an important component (statistically) of interpreting the calendar year trends, and we must instead look for other interpretations.
We consider two case studies where calendar year trend displays are extracted from the Multiple Probabilistic Trend Family (MPTF) for a number of LOBs.
Case Study 1: LOB 1 - LOB 6

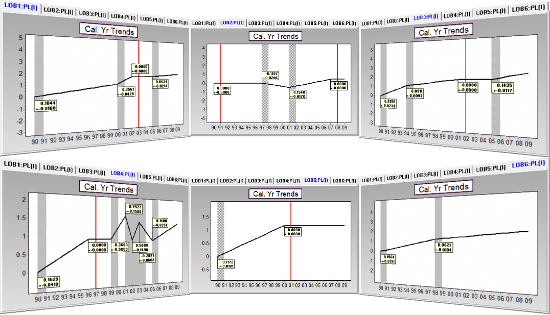
From left to right, top to bottom: LOB1, LOB2, LOB3, LOB4, LOB5, and LOB6
Although compressed for display purposes, it is immediately apparent that the calendar year trends displayed are very different by LOB. The closest LOBs, in terms of calendar year trend behaviour, are LOB 1 (top left) and LOB 3 (top right) but only since 2002-2003. The other four lines of business have calendar year trends unique to that porfolio.
The trends in LOB 4 (lower left) have nothing to do with economic inflation - other drivers are causing such extreme changes in calendar year trends. If this was a large segment of the company, then identifying the cause of the volatility and projecting accurate future calendar year trend changes becomes critical. Using an average, or industry trend, could result in the company being in distress as a result of a poor calendar year trend selection!
Case Study 2: Berkshire Hathaway PPA, CAL, WC versus Industry PPA, CAL, WC

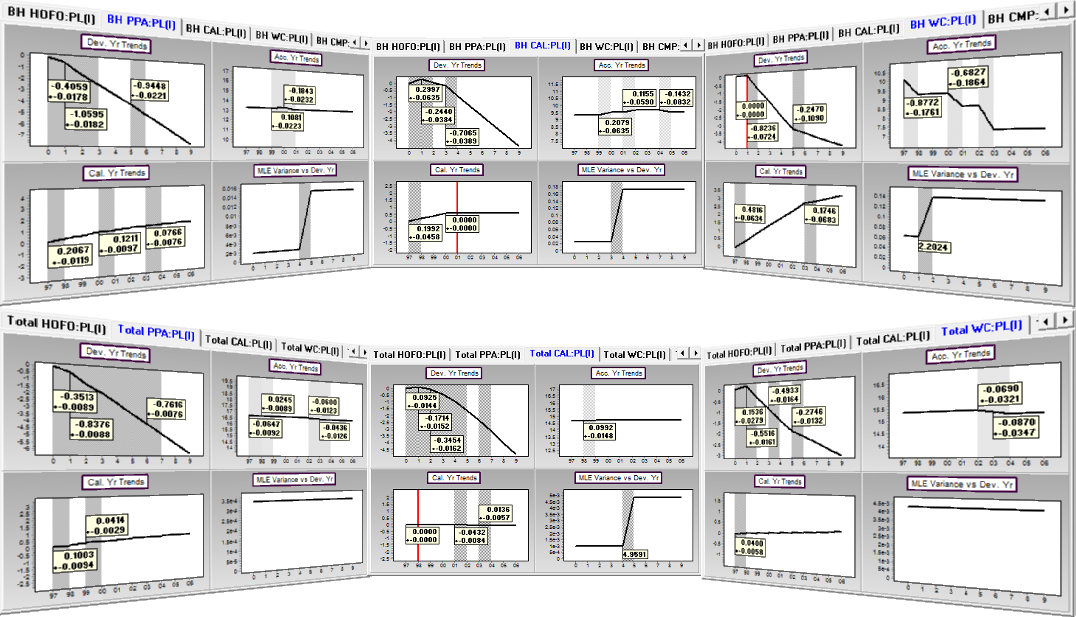
Upper Images: Berkshire Hathaway (PPA, CAL, WC); Lower Images: Industry (PPA, CAL, WC)
Once again, the calendar year trends are distinct by LOB - including between seemingly related lines of Private Passenger Automobile (PPA) and Commercial Auto Liabilities (CAL)! Furthermore, the calendar year trends are very different by LOB from the Industry.
Each companies' data are unique in respect of mix of risks, distinct from the industry, and it is inappropriate to use trends from the industry in place of trends found in an individual companies' data.
Modelling the actual trends in the data is critical then, not just for future forecasting, but also Solvency II distress consideration. Distress should result from unusal events, not as a result of a poorly selected model or future trends.
Conclusion
In practice, social inflation (or non-economic inflation), is the primary driver of most calendar year trends.
In order to project alternative economic scenarios, it is necessary first to identify the calendar year (and other) trends in the data. Economic scenarios can then be included as modifications of these identified trends.
For instance, if economic inflation is currently 3% and a scenario being considered is that economic inflation increases to 5%, then the forecast scenario modification to apply is an increase of the identified trend by 2%. This way, the trends identified in the companies' data are retained, and economic scenarios can be considered meaningfully in relation to each company's mix of risk.
