ICRFS™ COM Automation - importing triangle or unit record transactional data.
The open interface (COM) to programming languages like Visual Basic gives you the flexibility to get data into ICRFS™, and information out, quickly and easily:
-
Import large amounts of triangle data.
Triangle or unit record transactional data in Microsoft Excel, Microsoft Access or other databases can be imported directly to an ICRFS™ database - see ICRFS Importer. Updating triangles each year or quarter can similarly be automated, including simple checks on the changes in forecast distributions that alert you to potential problems. New triangles can also be created from existing triangles - for example, incremental from cumulative, case reserve estimates from paid and incurred triangles, totals of a number of triangles. A demonstration is available here.
-
Model data using the wizard.
Run a wizard on all the triangles in a database to get a quick view of what is happening in your data. Then you can focus on the problem areas to get more information.
-
Customise and automate reporting.
Generate reports in COM-enabled software such as Excel or Word, customised to get the exact content and layout that you require.
-
Communicate directly with other software.
Import distributions and correlations into COM-enabled DFA software.
-
Update database including models.
The whole database can be updated seamlessly including models using the COM automation.
If you have access to a "transactional" database, it only requires a little more code to consolidate the data into the triangles that can then be imported in the same way.
Additional processing can also be done after the data is imported, such as running a wizard on the triangles you import. Once you have triangles and models set up, you can update the triangle groups each quarter or year using a similar process.
-
Communicating Directly With Other Software.
Do you have another program that requires the output from ICRFS™, such as a DFA software? If that software is COM-enabled, it will be able to get the information it requires - such as means, standard deviations and correlations of loss reserve distributions for each future calendar year - without you even opening ICRFS™.
-
Technical Information.
ICRFS™ can be exposed as a COM automation server to be driven by automation client applications. The ICRFS™ data model and modelling framework are currently exposed via automation. Users who have some experience with one of the scripting languages (like VBScript) will be able to integrate ICRFS™ with their specific needs, such as customised reporting and programmatic access to the ICRFS™ database.
The ICRFS™ COM object model is designed with various scripting automation clients in mind, including:
- Windows Script Host,
- Office applications (scripting in Word and Excel),
- HTML scripting (DHTML),
- R.
Several example HTML and Visual Basic for Excel scripts are provided.
Gain a competitive advantage using ICRFS™ and Schedule P data
Compare your company to other companies and the industry
Armed with ICRFS™ and Best's Schedule P data you have access to much information, with a few mouse clicks, that cannot be obtained in any other way.
Here is a powerful example.
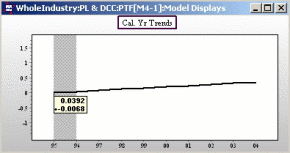
Costs per claim have been rising at a fairly steady rate of about
4% per annum in the industry as a whole, for the last ten years.
If the number of claims is constant from year to year, premiums
should be increasing by at least 4% each year, as should the
overall reserves held by the industry.
Industry
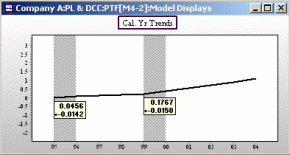
Company A has a rather different picture. Costs per claim were rising
at about the same rate as the industry overall from 1995 to 1999.
But then they began to rise at about 18% per annum!
If they are continuing to write about the same amount of business,
they will need to increase their total reserves by about 18% every year
to maintain adequate cover. Premiums will need to increase at this rate too.
This company needs to look hard at their business to see what happened
in 1999. Whatever the cause, they need to find out soon before they are
wiped out by rising costs.
Company A
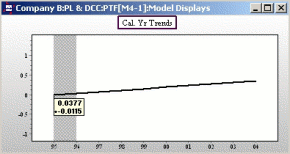
Company B, on the other hand, is in a much better position.
Their costs per claim are increasing at about the industry average.
They can afford to limit their increase in premiums and total reserves
to 4% per year, giving them a big competitive advantage over Company A.
Company B
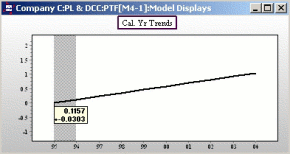
Company C has had costs per claim rising at about 12% per annum since at
least 1995, about three times the rate of the industry total. Does this company
have a niche market that is prepared to pay above the industry rate?
Or are they about to be caught out by years of under-charging and under-reserving?
Company C

 Costs per claim have been rising at a fairly steady rate of about
 Company A has a rather different picture. Costs per claim were rising
